


A Visual Recap of Tata Steel Chess 2025
Summarising the tournament with 8 plots

As every year, the Tata Steel tournament in Wijk aan Zee was very exciting. Many young stars participated and the battle for first place was hard thought.
I want to take a look back at the masters and challengers tournament by looking at different graphs that summarise the play.
Masters Section
Scores
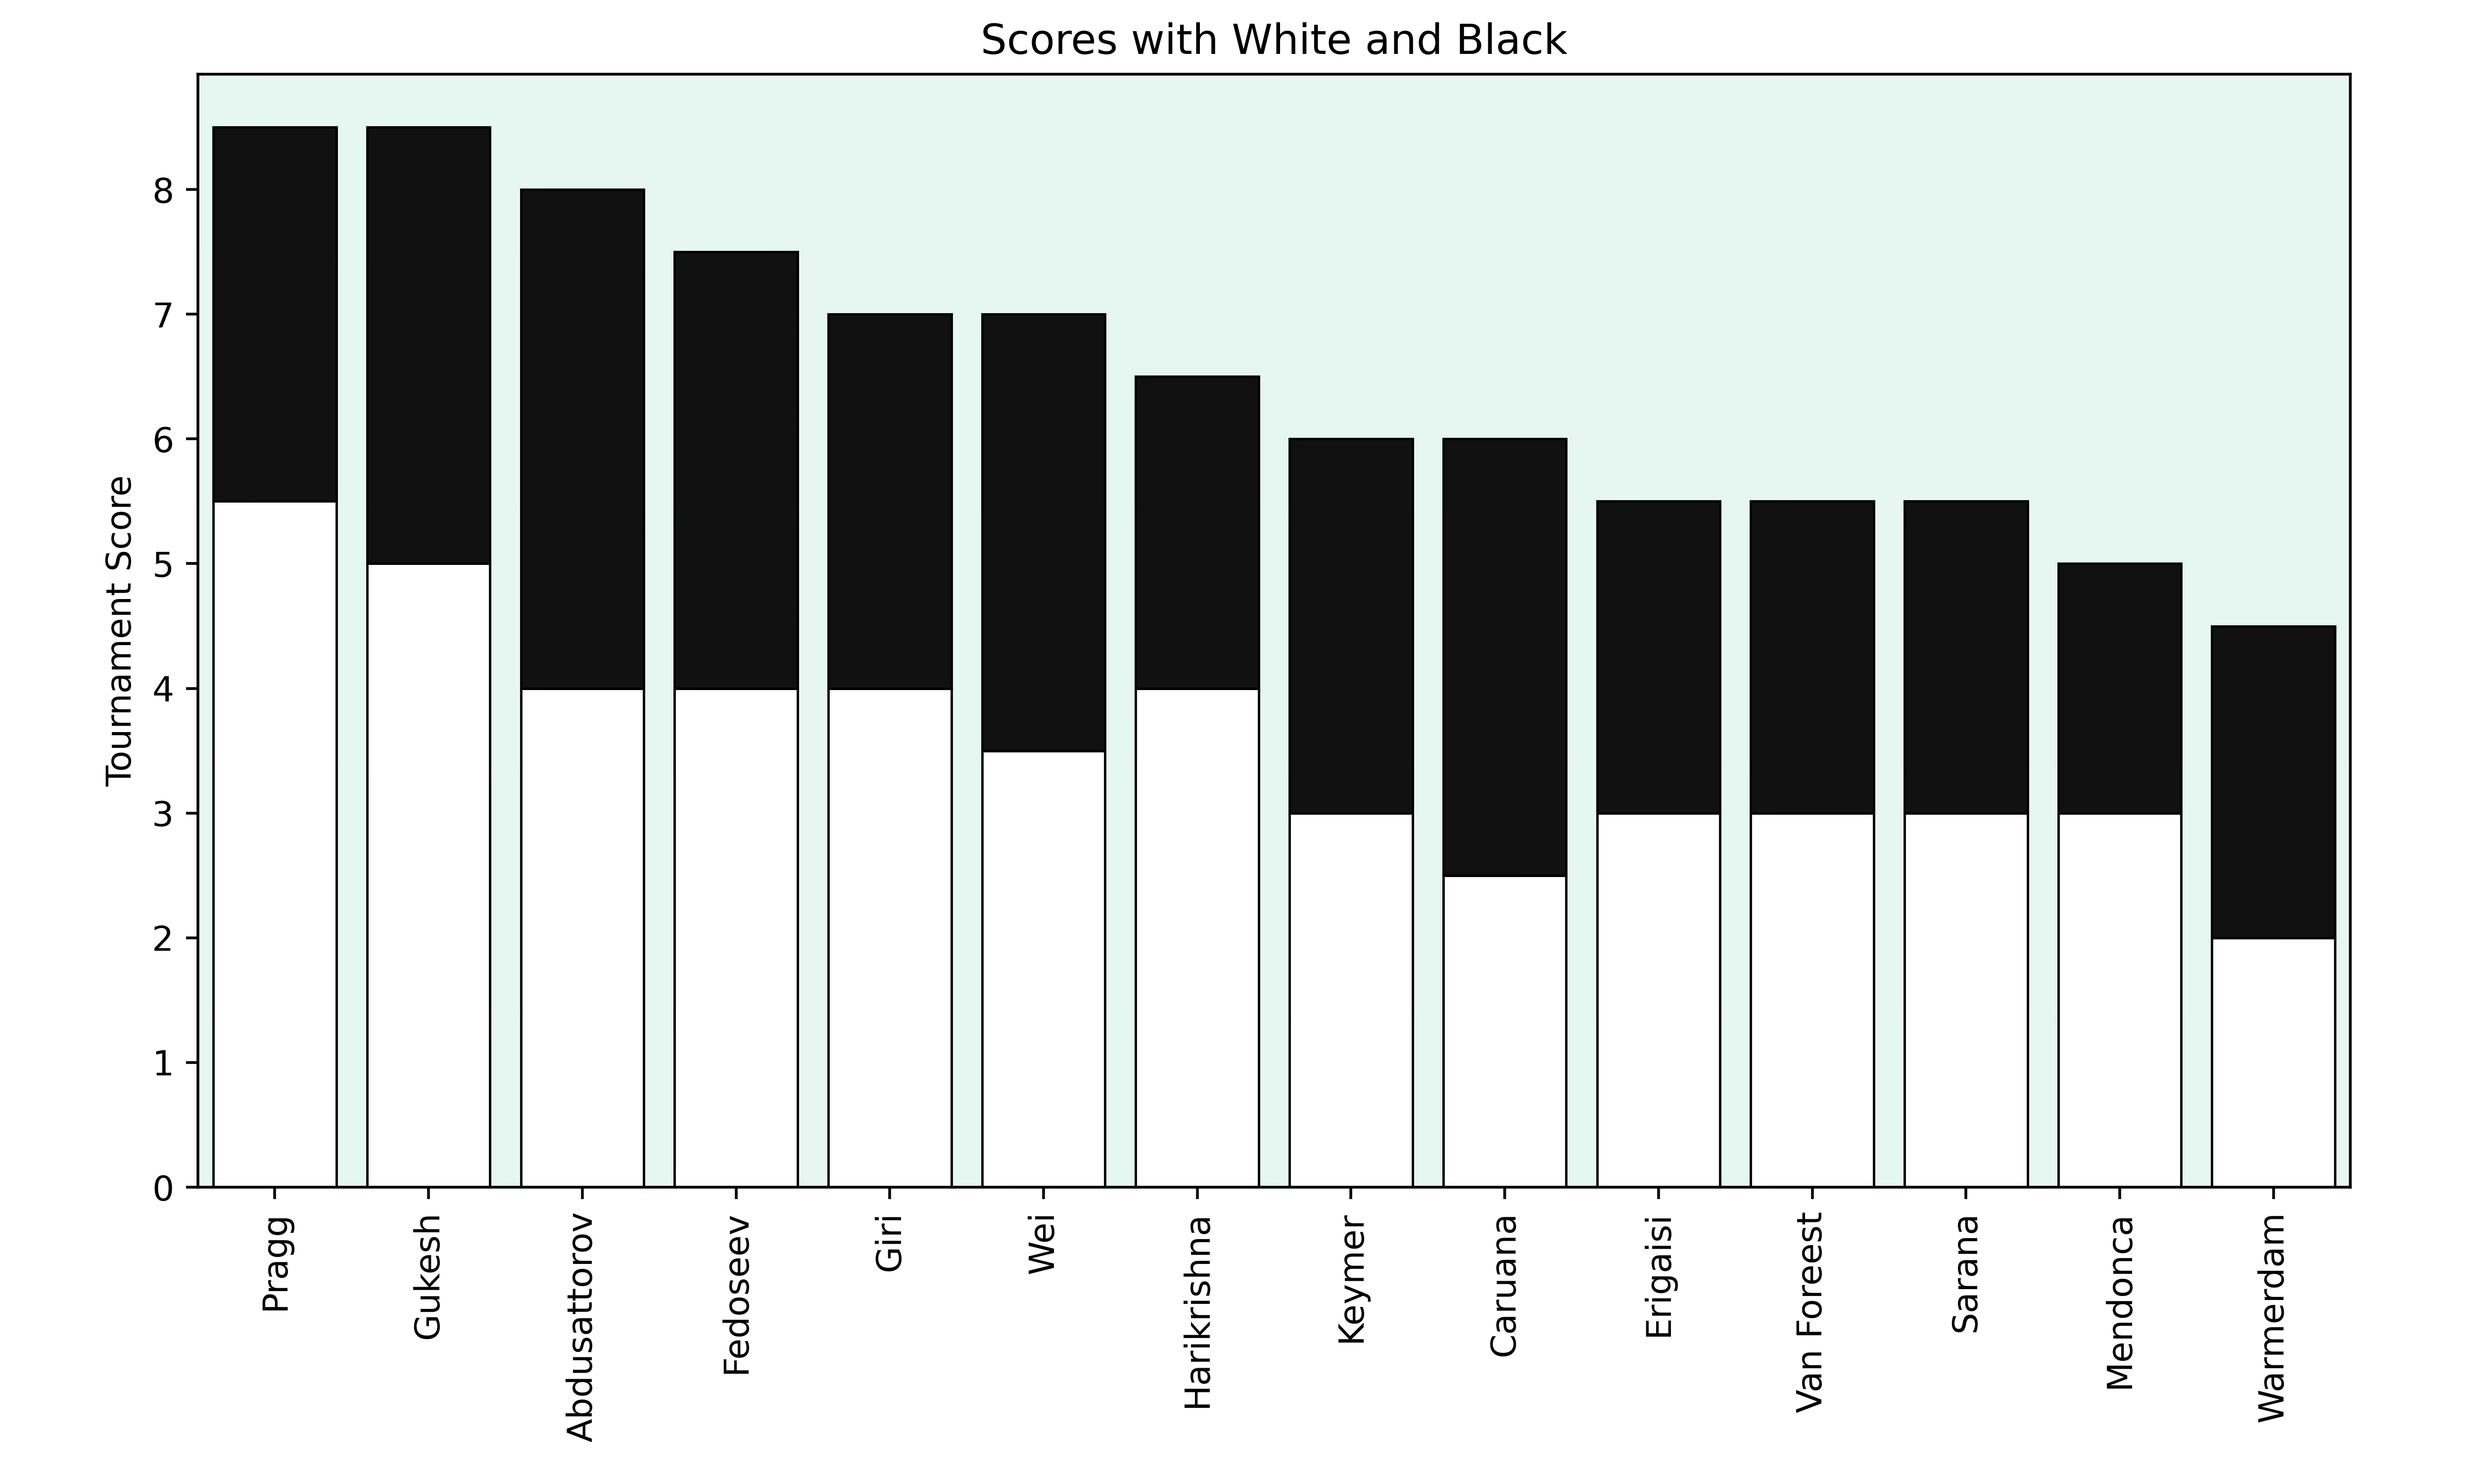
I like to look at the scores of the players with each colour since this often shows some interesting discrepancies. But this wasn't the case in Wijk aan Zee this year and almost everyone scored slightly better with white than with black, as one would expect.
However, the fight for first place was really tight so I wanted to look how it played out over the 13 rounds of the tournament.
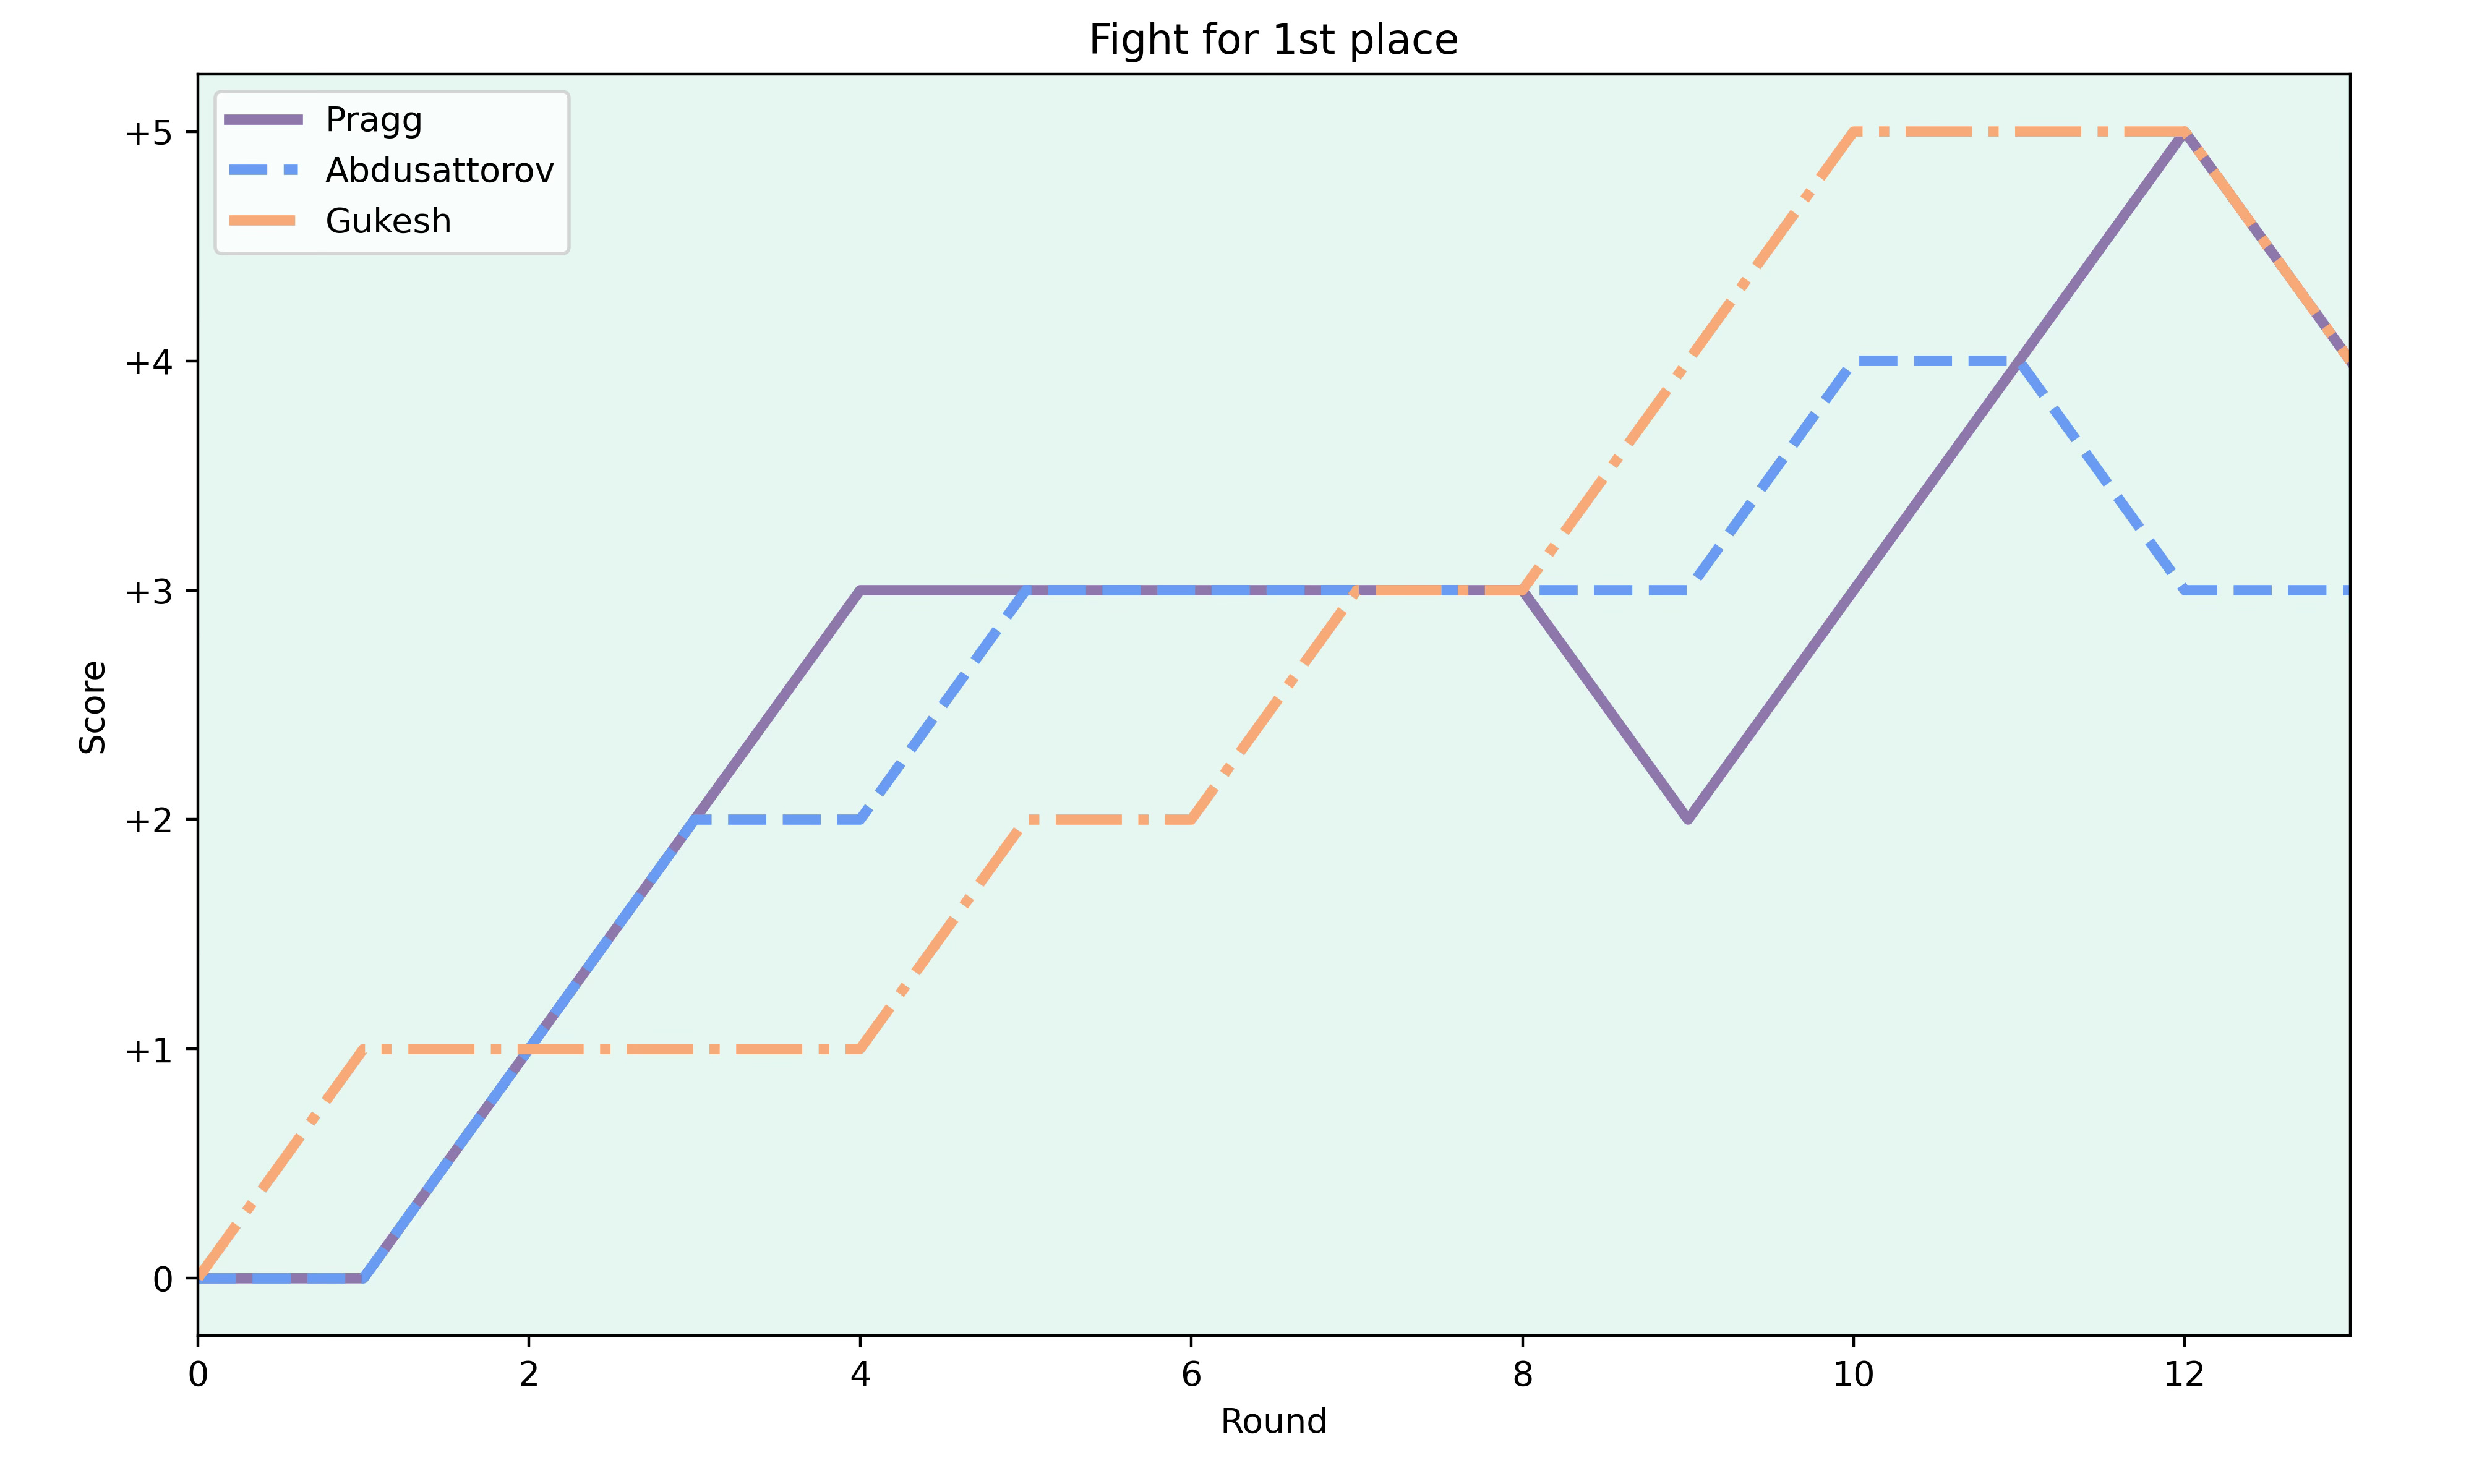
After a first round win, Gukesh had a slower start than Pragg and Abdusattorov. But then the world champion scored 5 points in 6 games to take the lead of the tournament. Pragg won three games in a row twice in this tournament and caught up to Gukesh after round 12 before both leaders lost their final round.
This meant that the two Indians played tiebreak to determine the winner. To visualise what happened in that blitz match, I looked at the expected match points of the players after each move of the match.
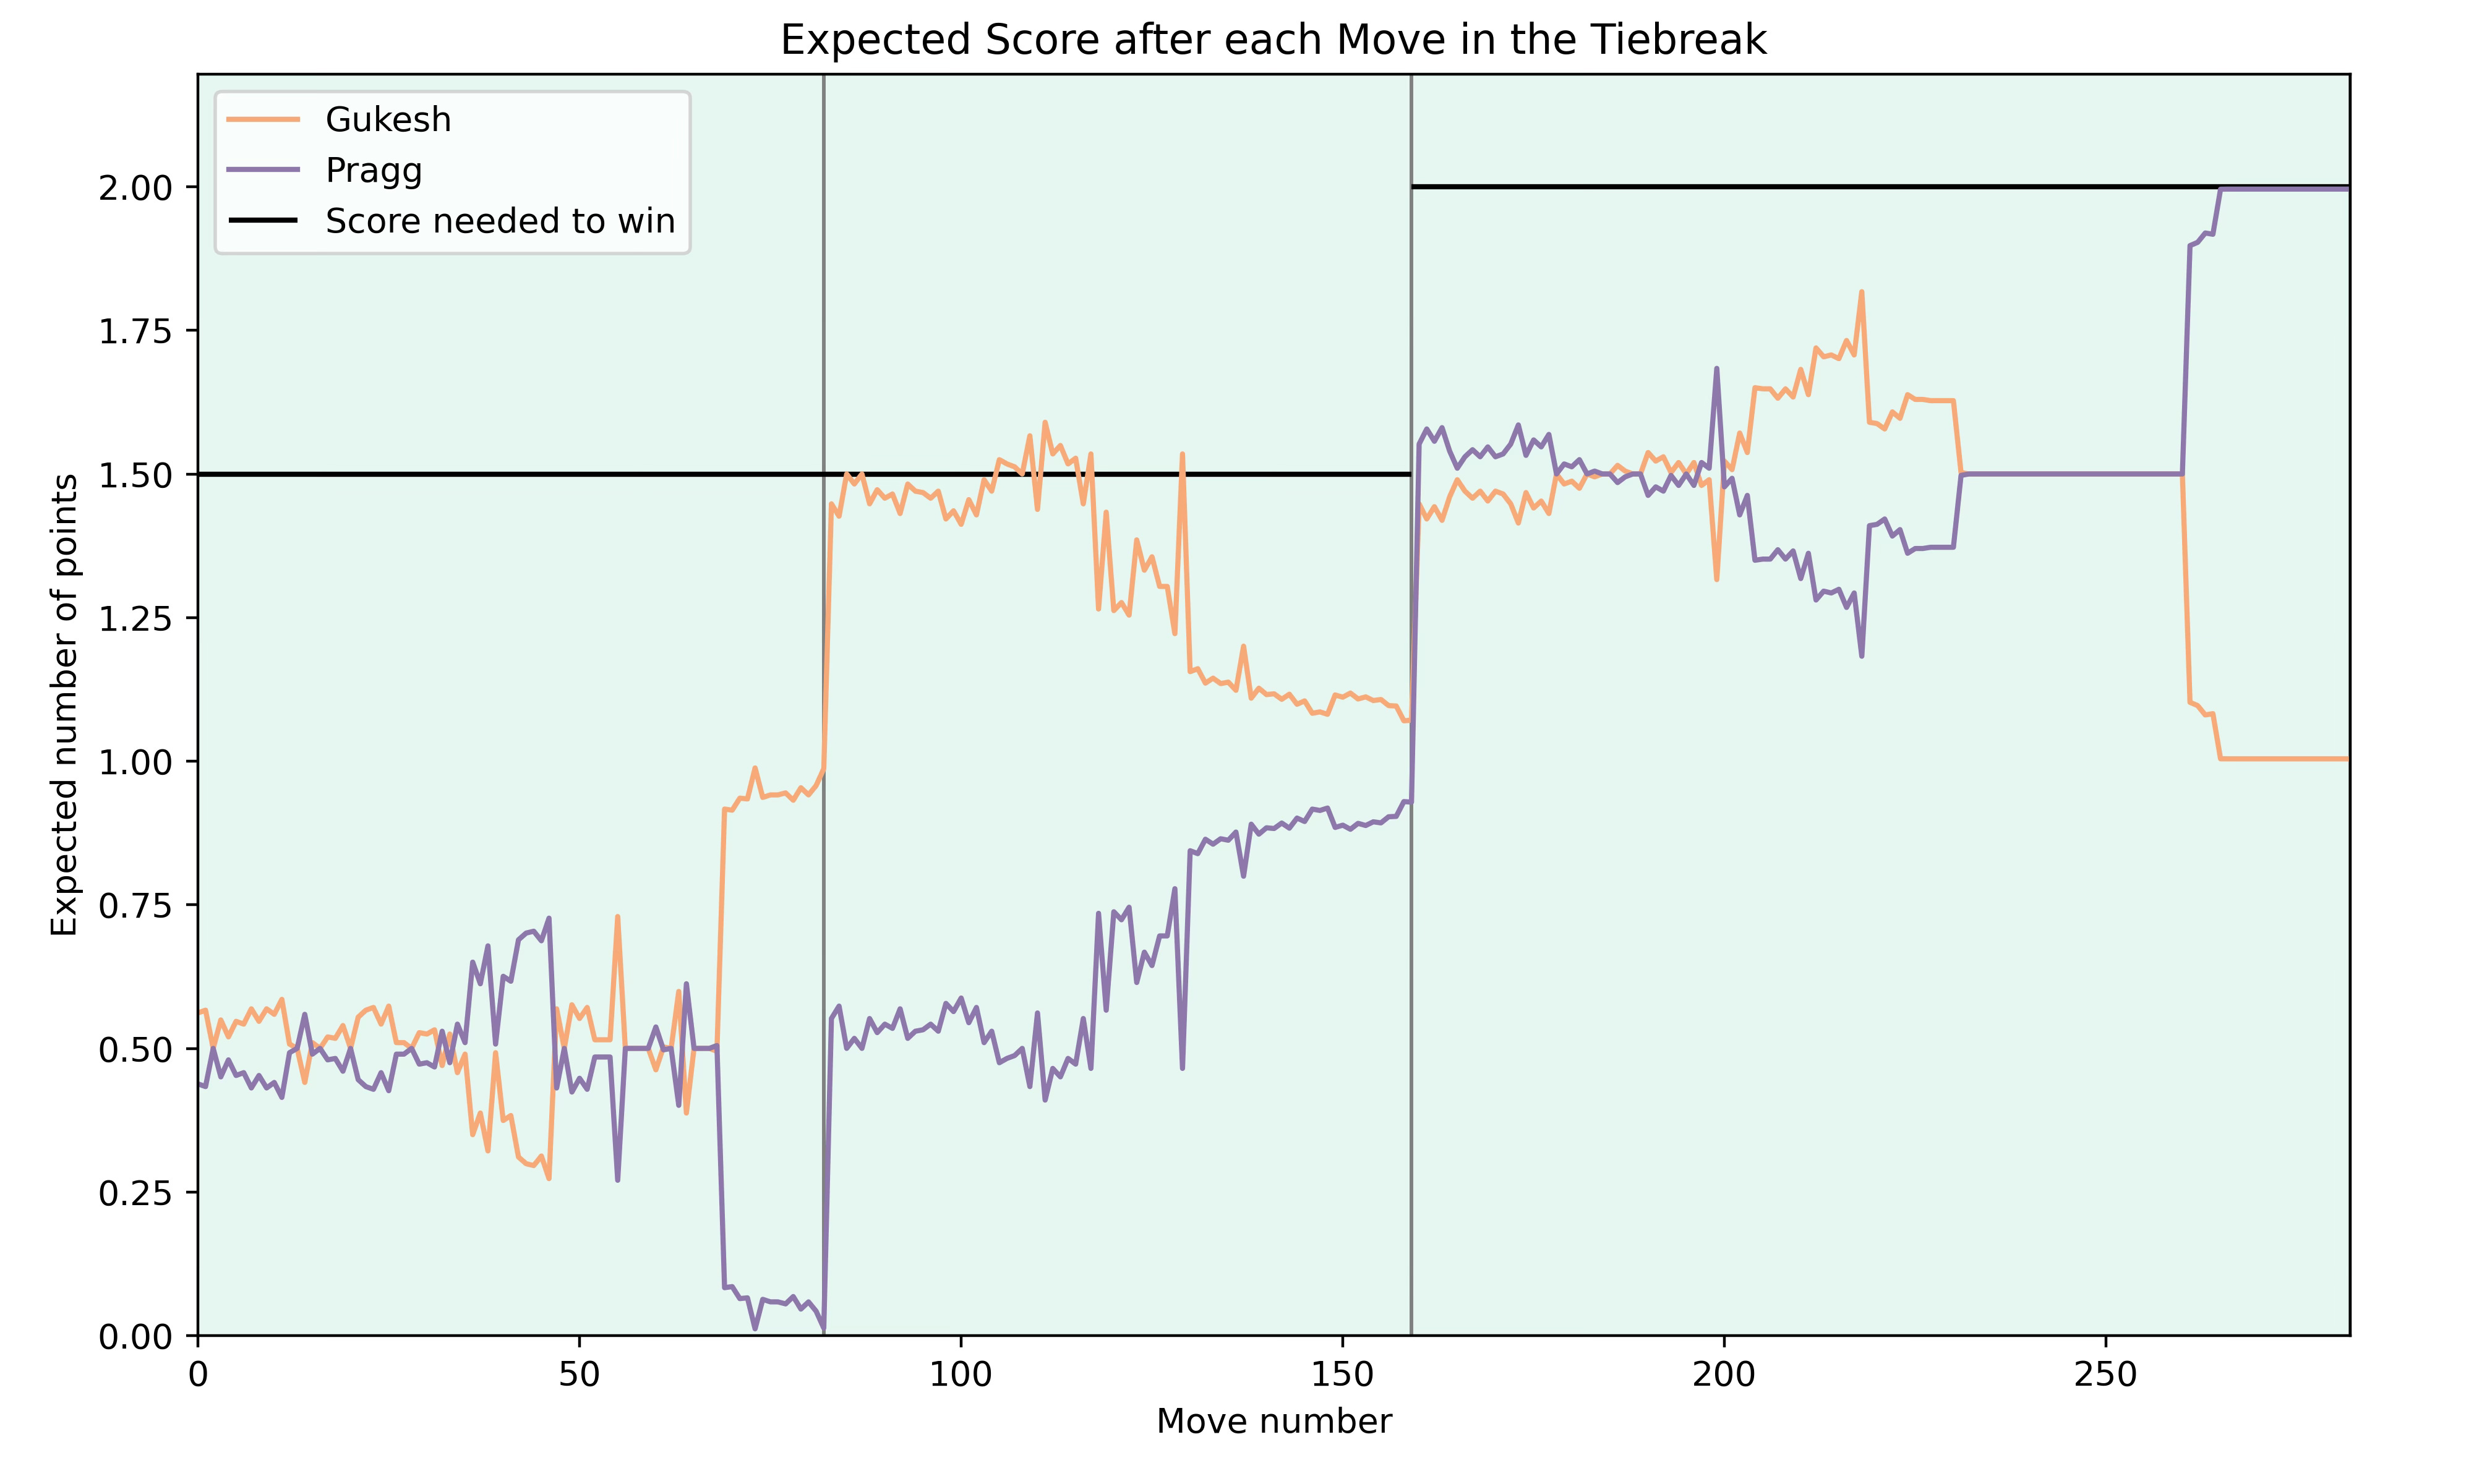
The expected number of points is calculated by taking the expected score after each move and adding it to the points the player had before the game. The vertical lines show the beginning of new games.
After winning the first game, Gukesh was clearly the favourite, but he lost the second game and after having good winning chances in the first sudden death game, he lost that one as well. So Praggnanandhaa won the tournament with a great performance.
Engine Analysis
As the scores never tell the full story of a tournament, I like to analyse the games with engines to getter better insights into how accurately the players were playing.
To get a first overview of how well the players played according to Stockfish, I looked at the number of inaccuracies, mistakes and blunders.
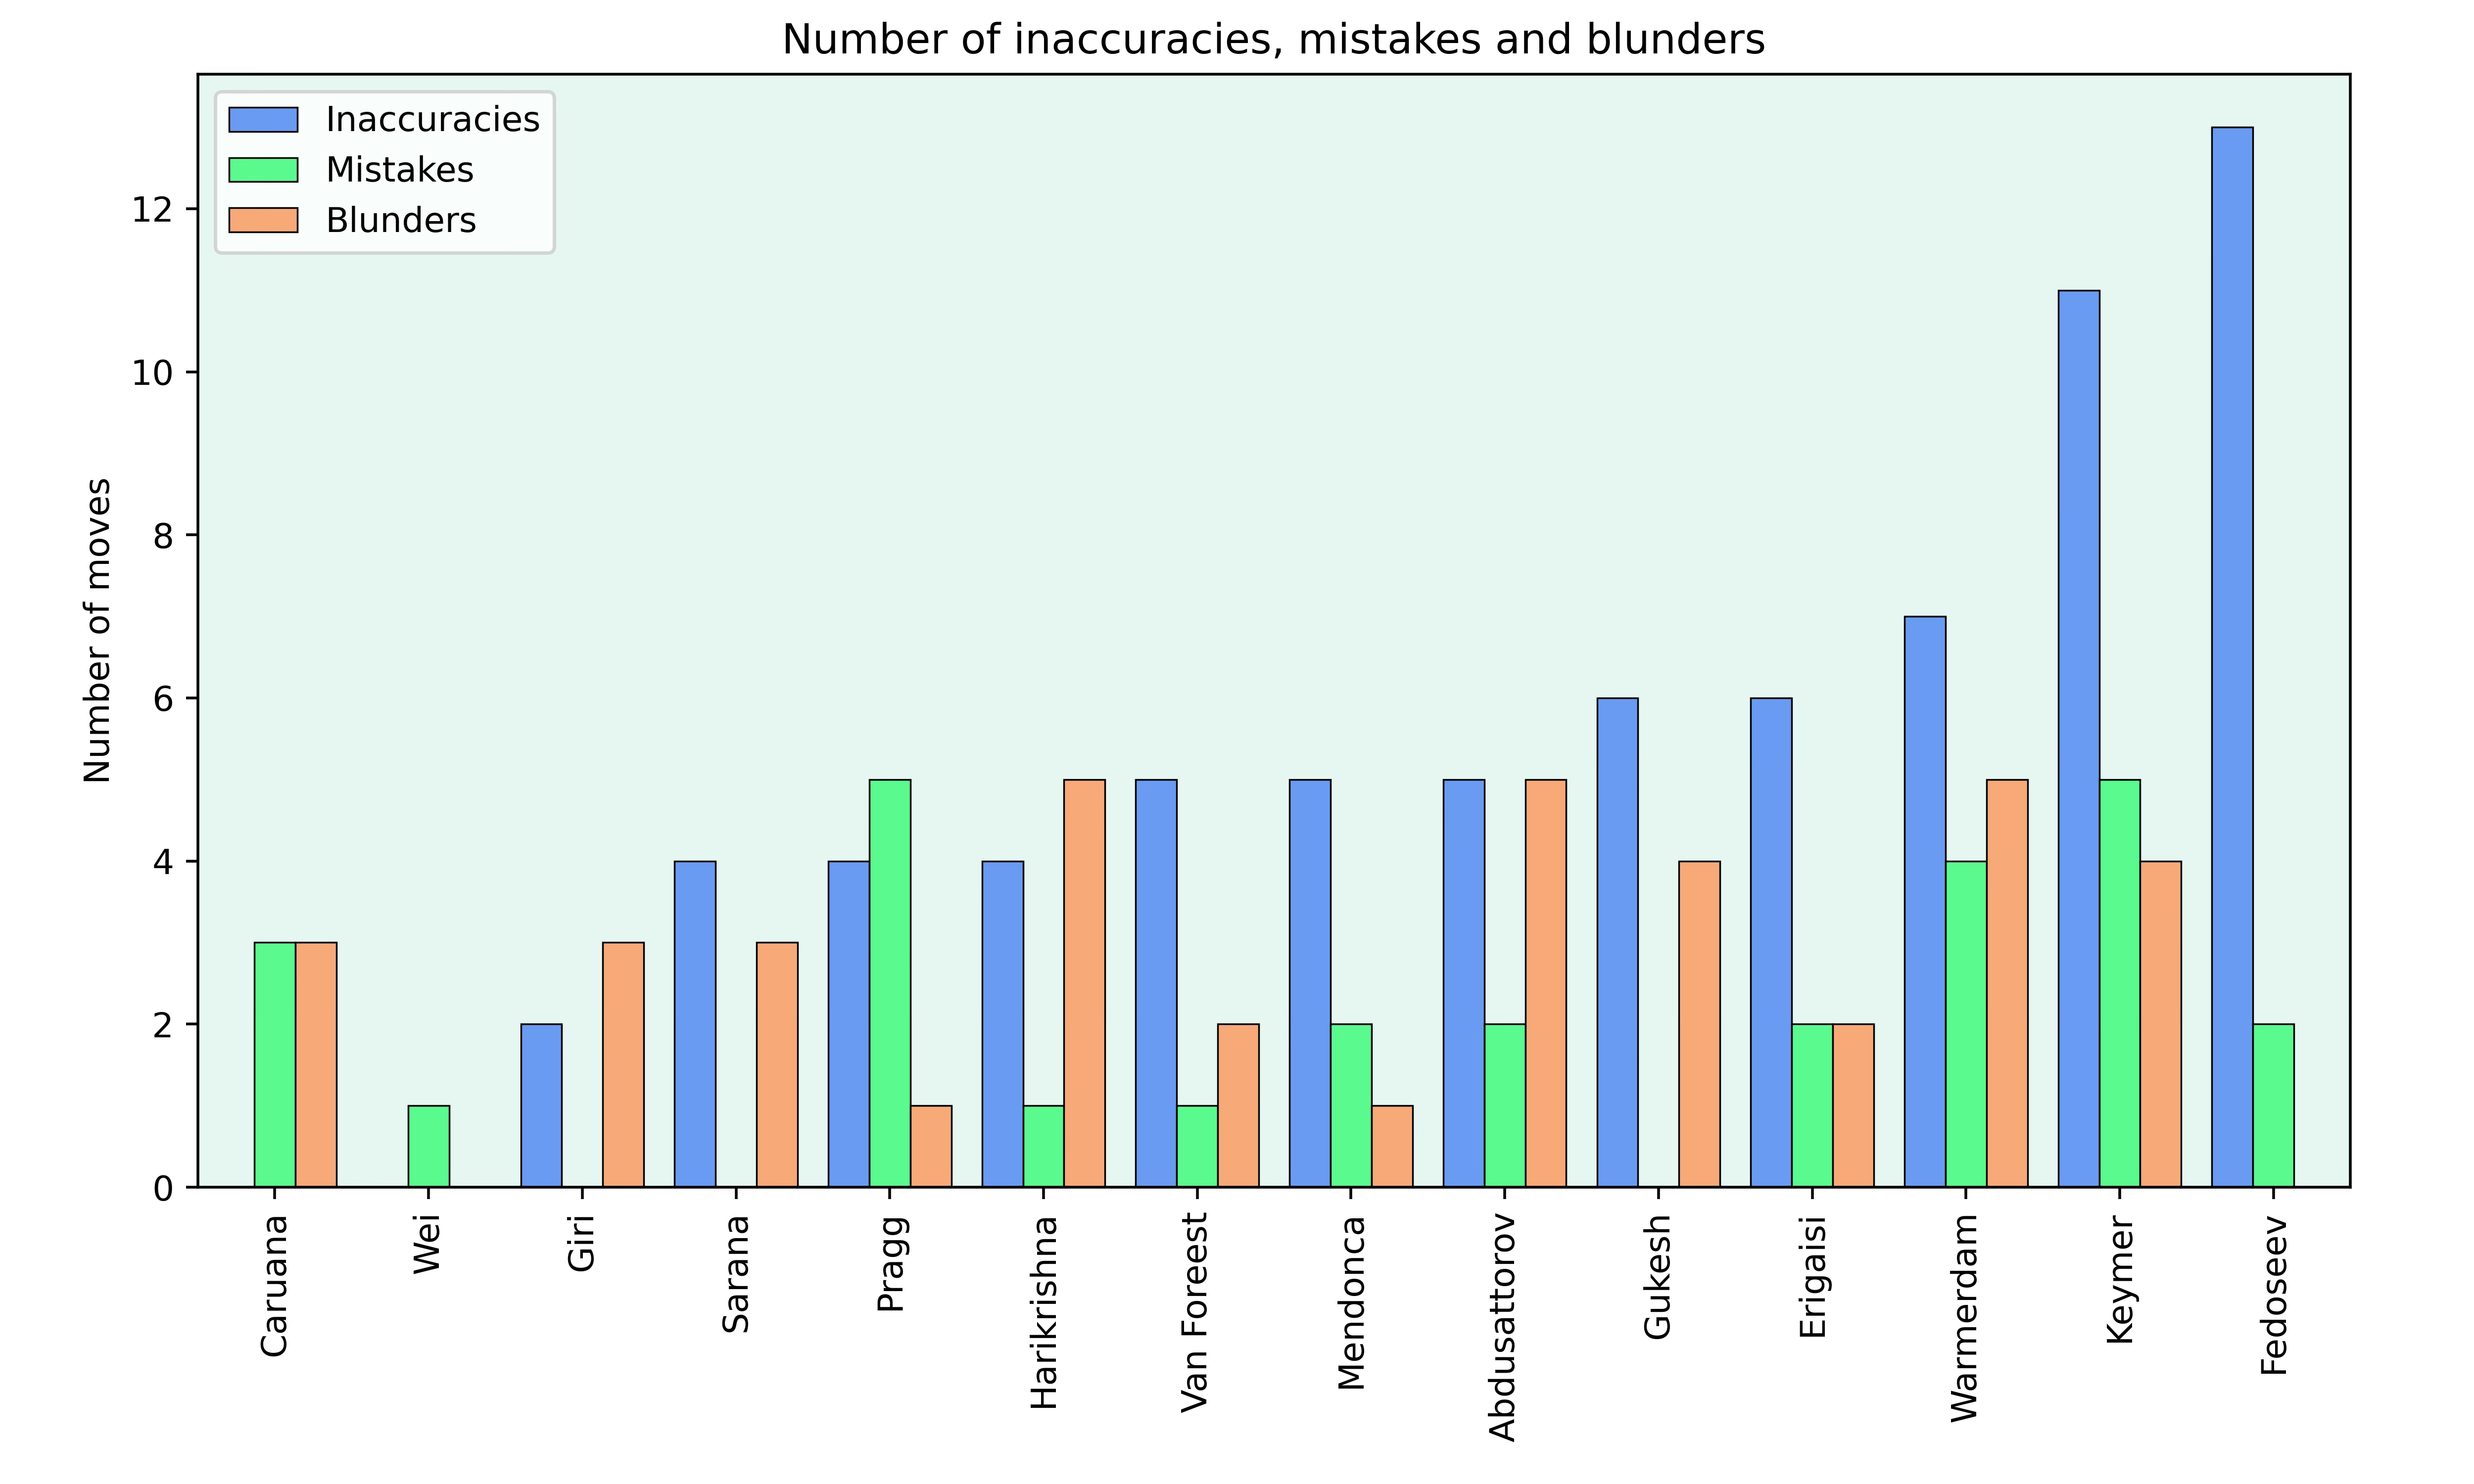
It’s super interesting to see that Wei Yi only made one mistake in the whole tournament. In comparison, the top finishers Pragg and Gukesh made a lot more mistakes and blunders. This shows that taking risks and going into positions where both sides will make mistakes often leads to better tournament outcomes.
The same can be seen when looking at the average game accuracy for each player and their opponents.
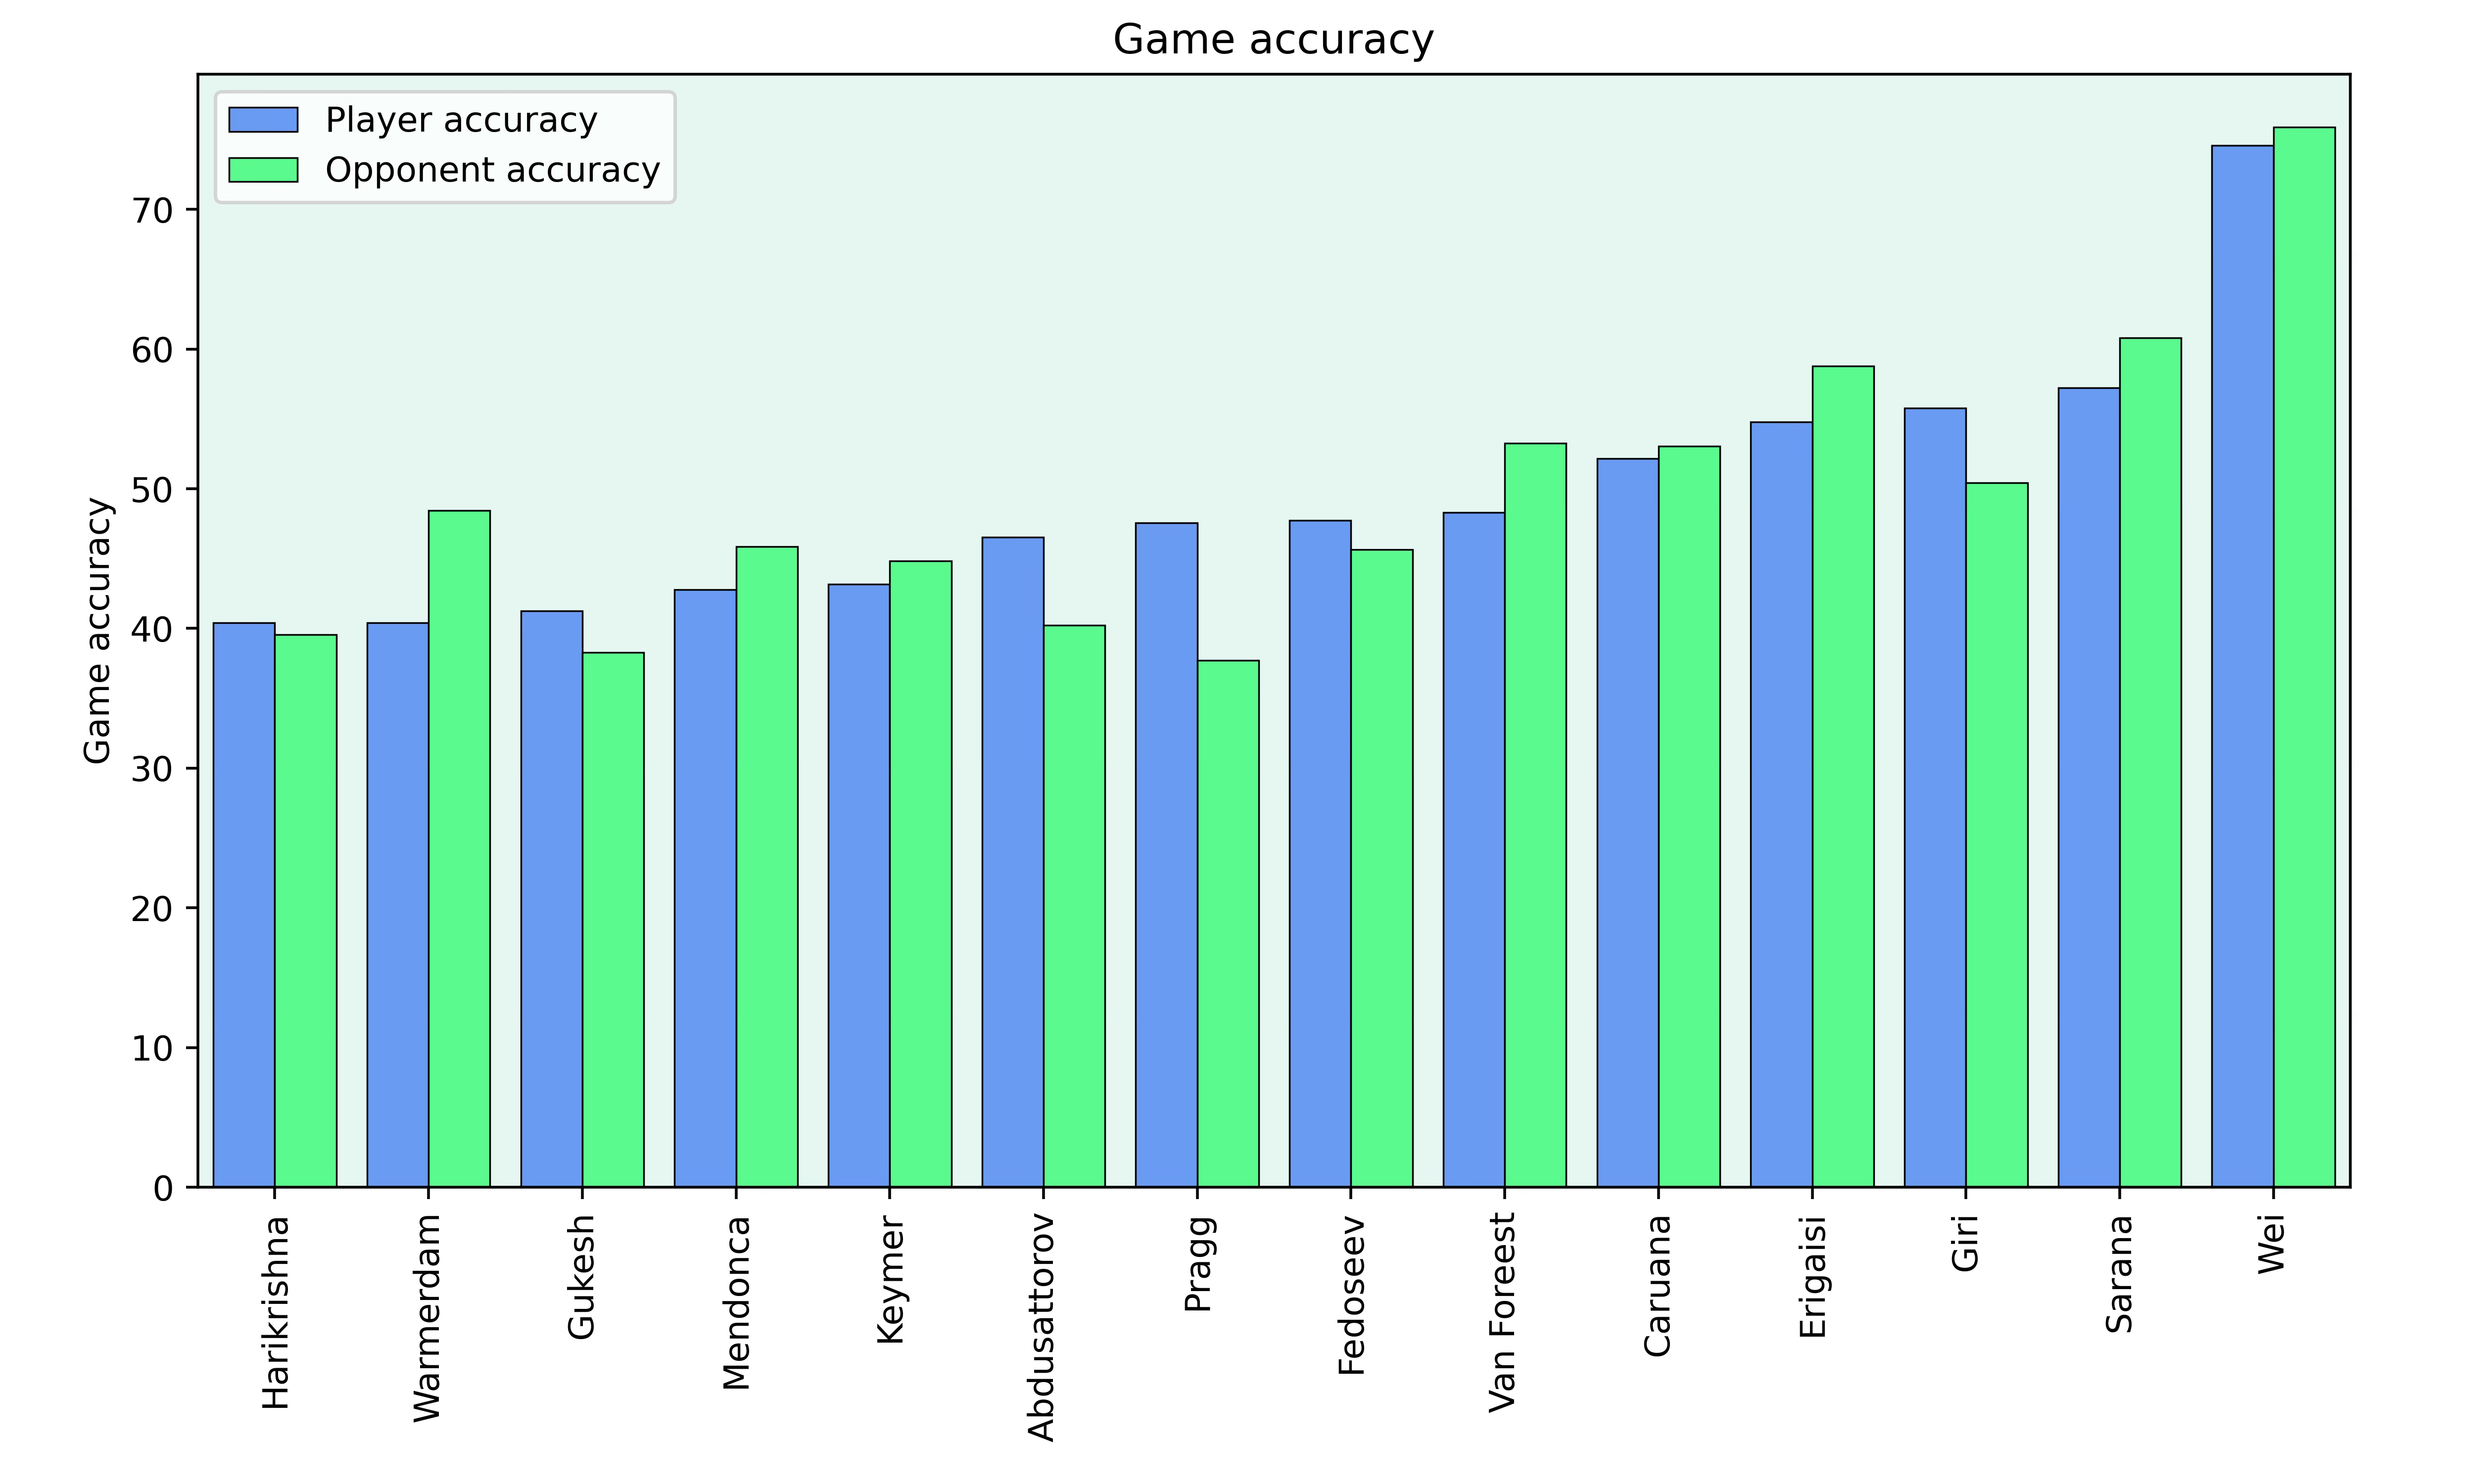
Note that I use my own accuracy score which is based on the average move quality compared to other GM games. So the scores are much lower than the accuracy scores from chess websites.
Again, Wei Yi was by far the most accurate player but in the games his opponent’s were even more accurate. Compare this to Pragg who had a much lower overall accuracy than Wei Yi, but he was much more accurate than his opponents. So he navigated the complicated positions better and hence scored many points.
Better and Worse Games
Another interesting thing to look at is the relative number of moves where each player was standing better, equal or worse. To do this, I divided the evaluation after each move into 5 classes, much better (>+1 according to Stockfish), slightly better (between 1 and 0.5), equal (between 0.5 and -0.5), slightly worse and much worse.
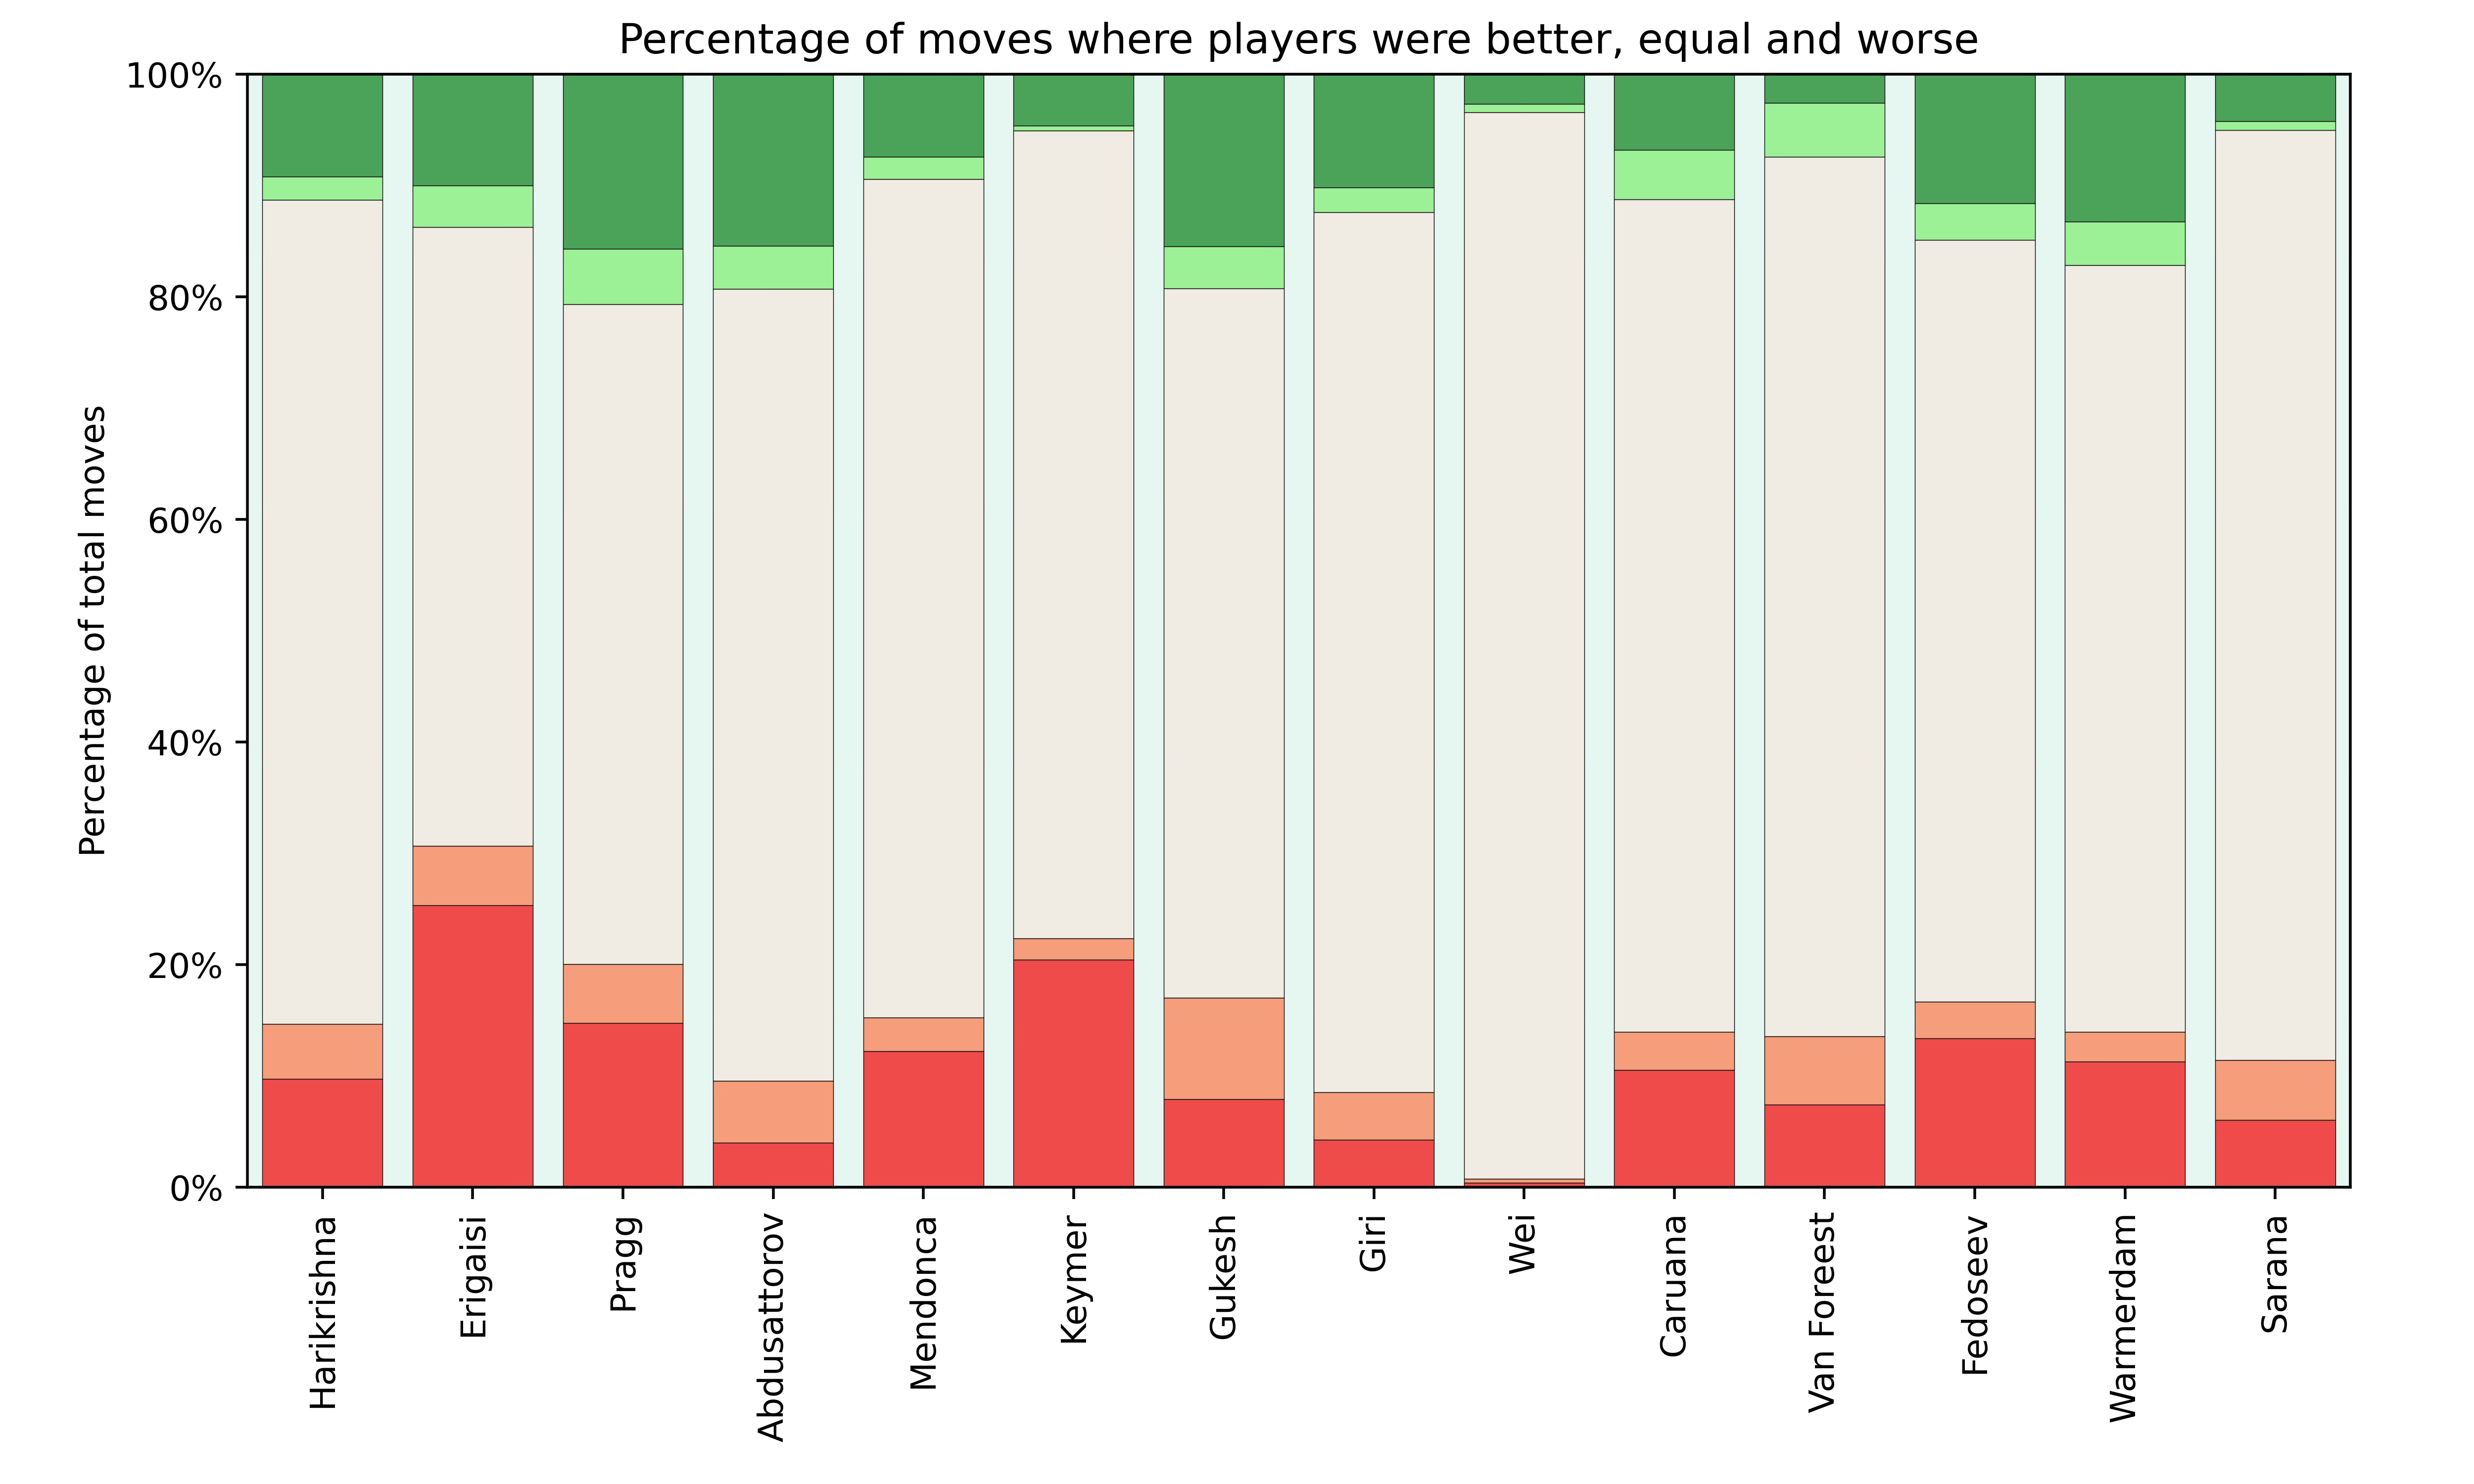
This shows once again that Wei Yi apparently wasn’t taking too many risks but also wasn’t getting many better positions. It can also be seen that Erigaisi was very often in trouble and had a difficult tournament. Also the difference between Pragg, Gukesh and Abdusattorov is very interesting. From this graph it looks like Abdusattorov had the best tournament even though he didn’t finish in first.
Finally I want to look at how well players converted their advantages and how resilient they were in bad positions.
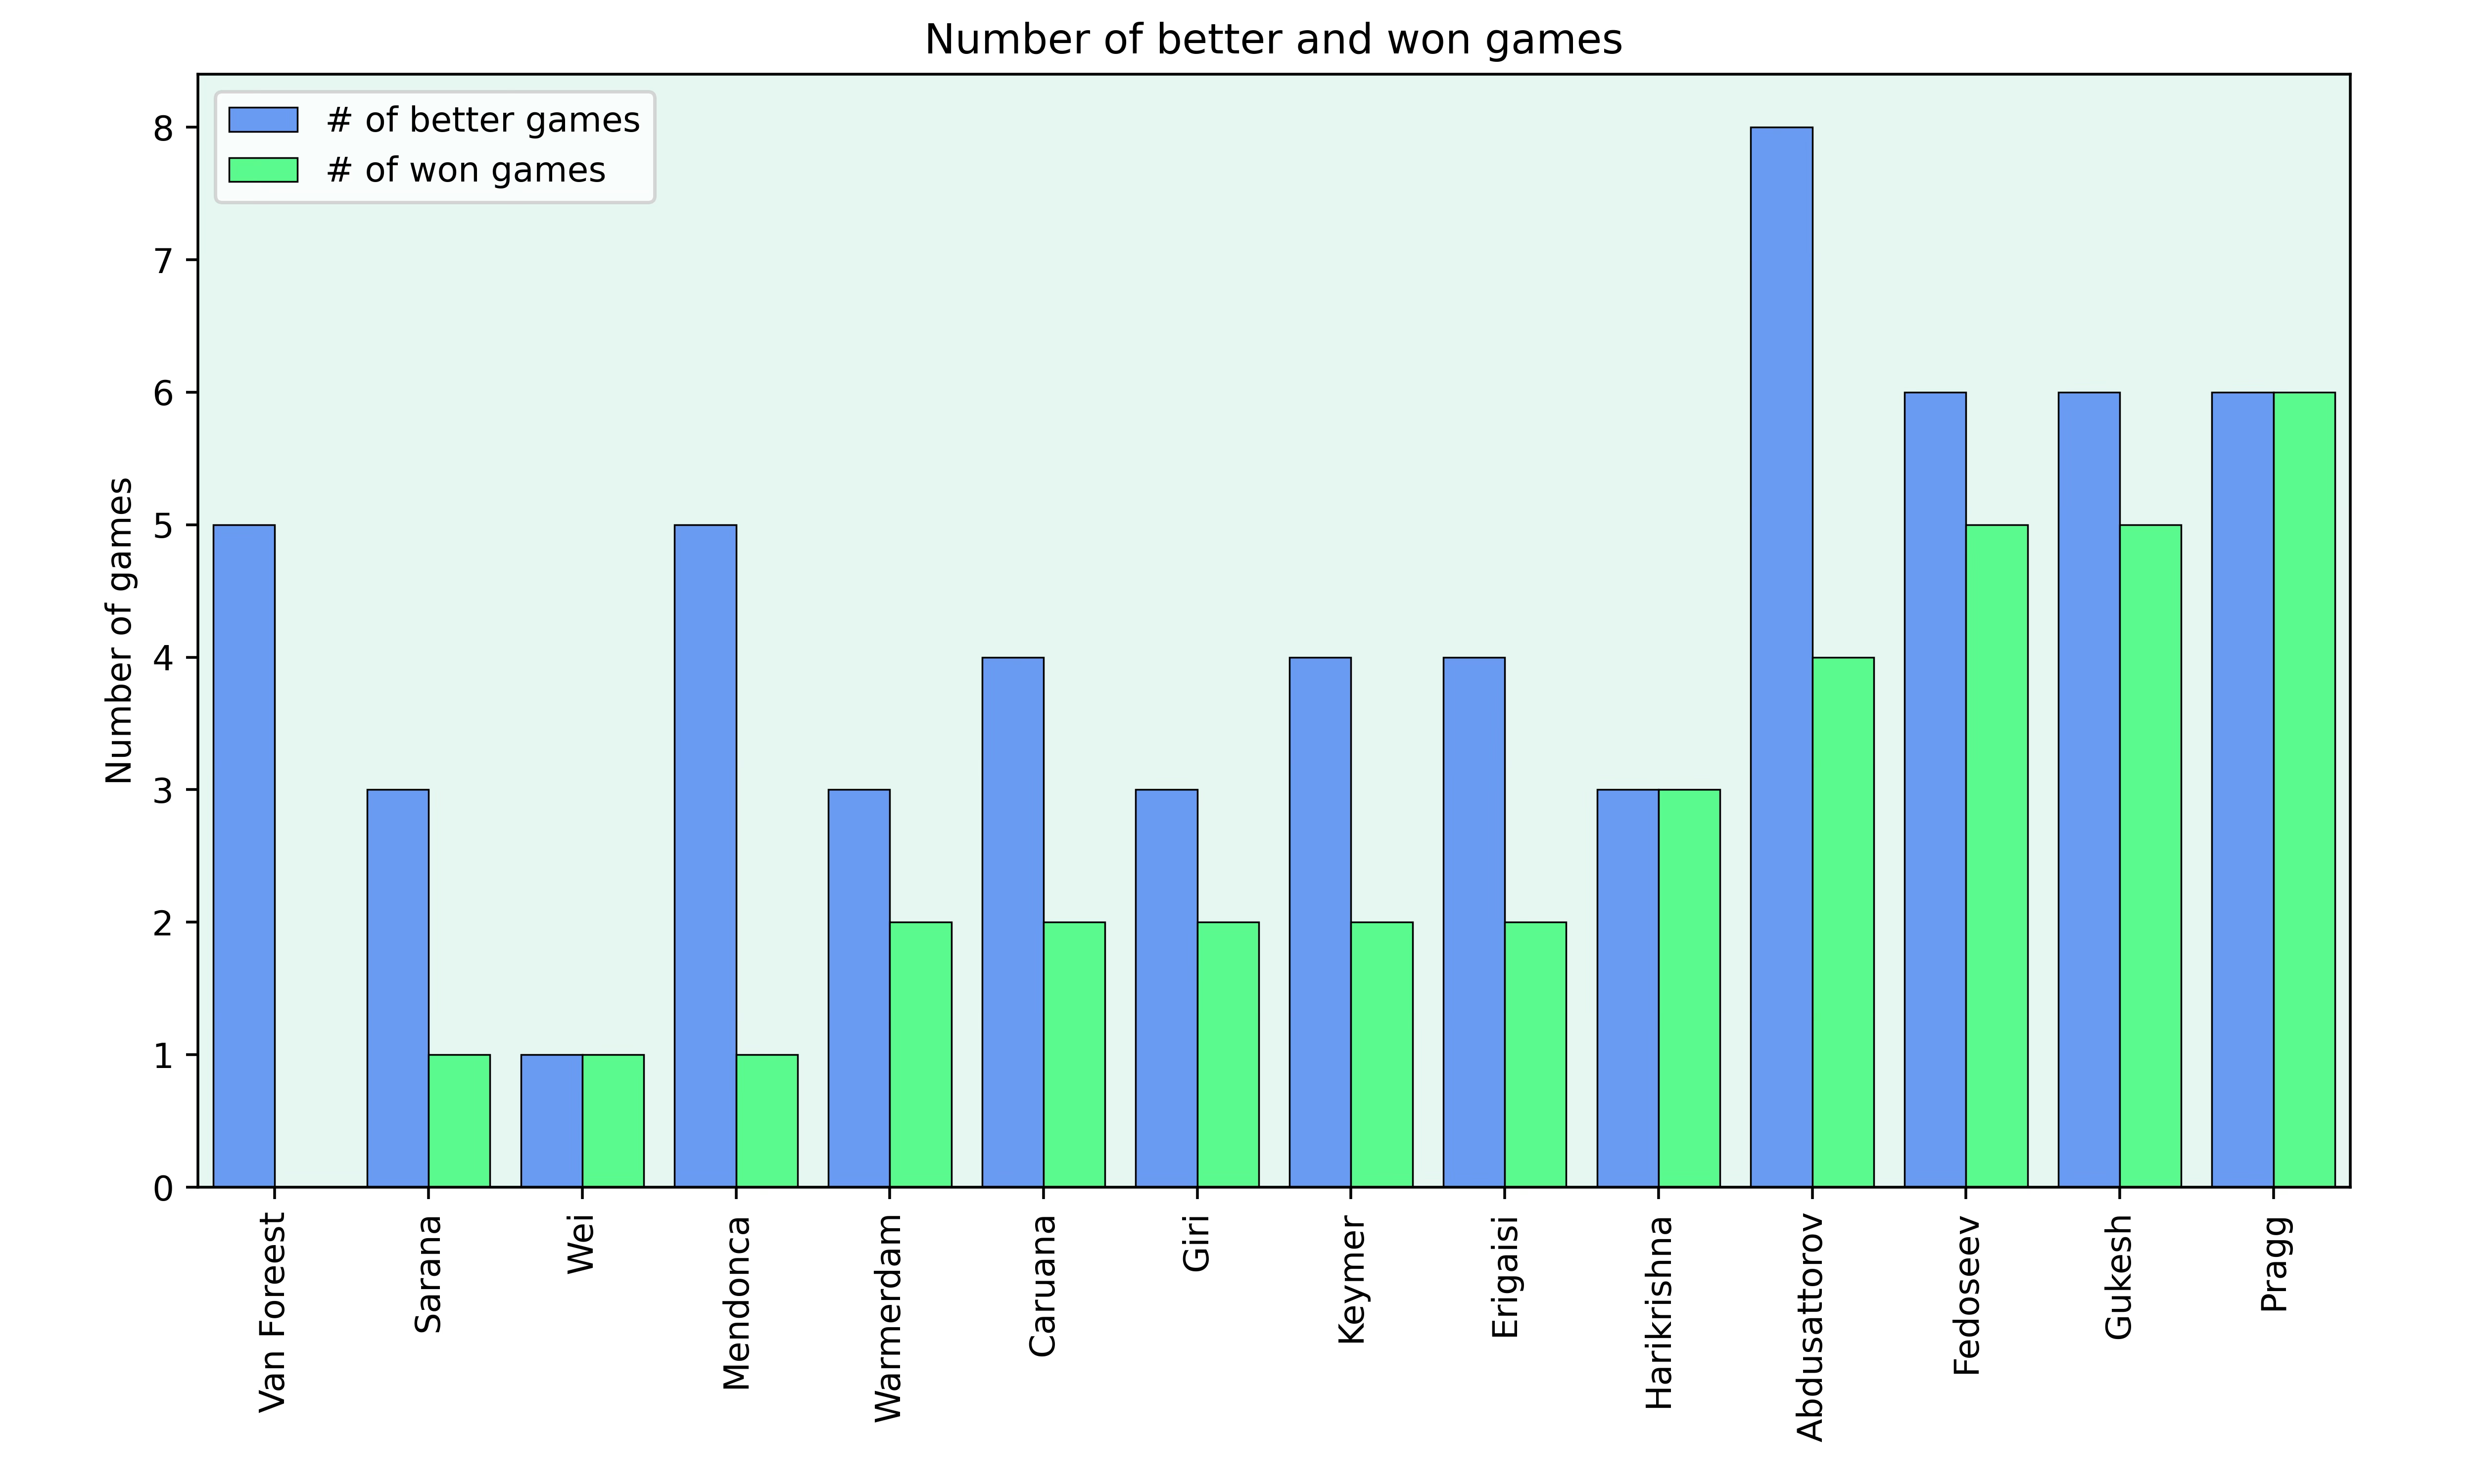
This shows that Abdusattorov had many games where he had a better position, but only converted half of them into full points. Pragg on the other hand was clinical and converted each game where he was standing better into a win.
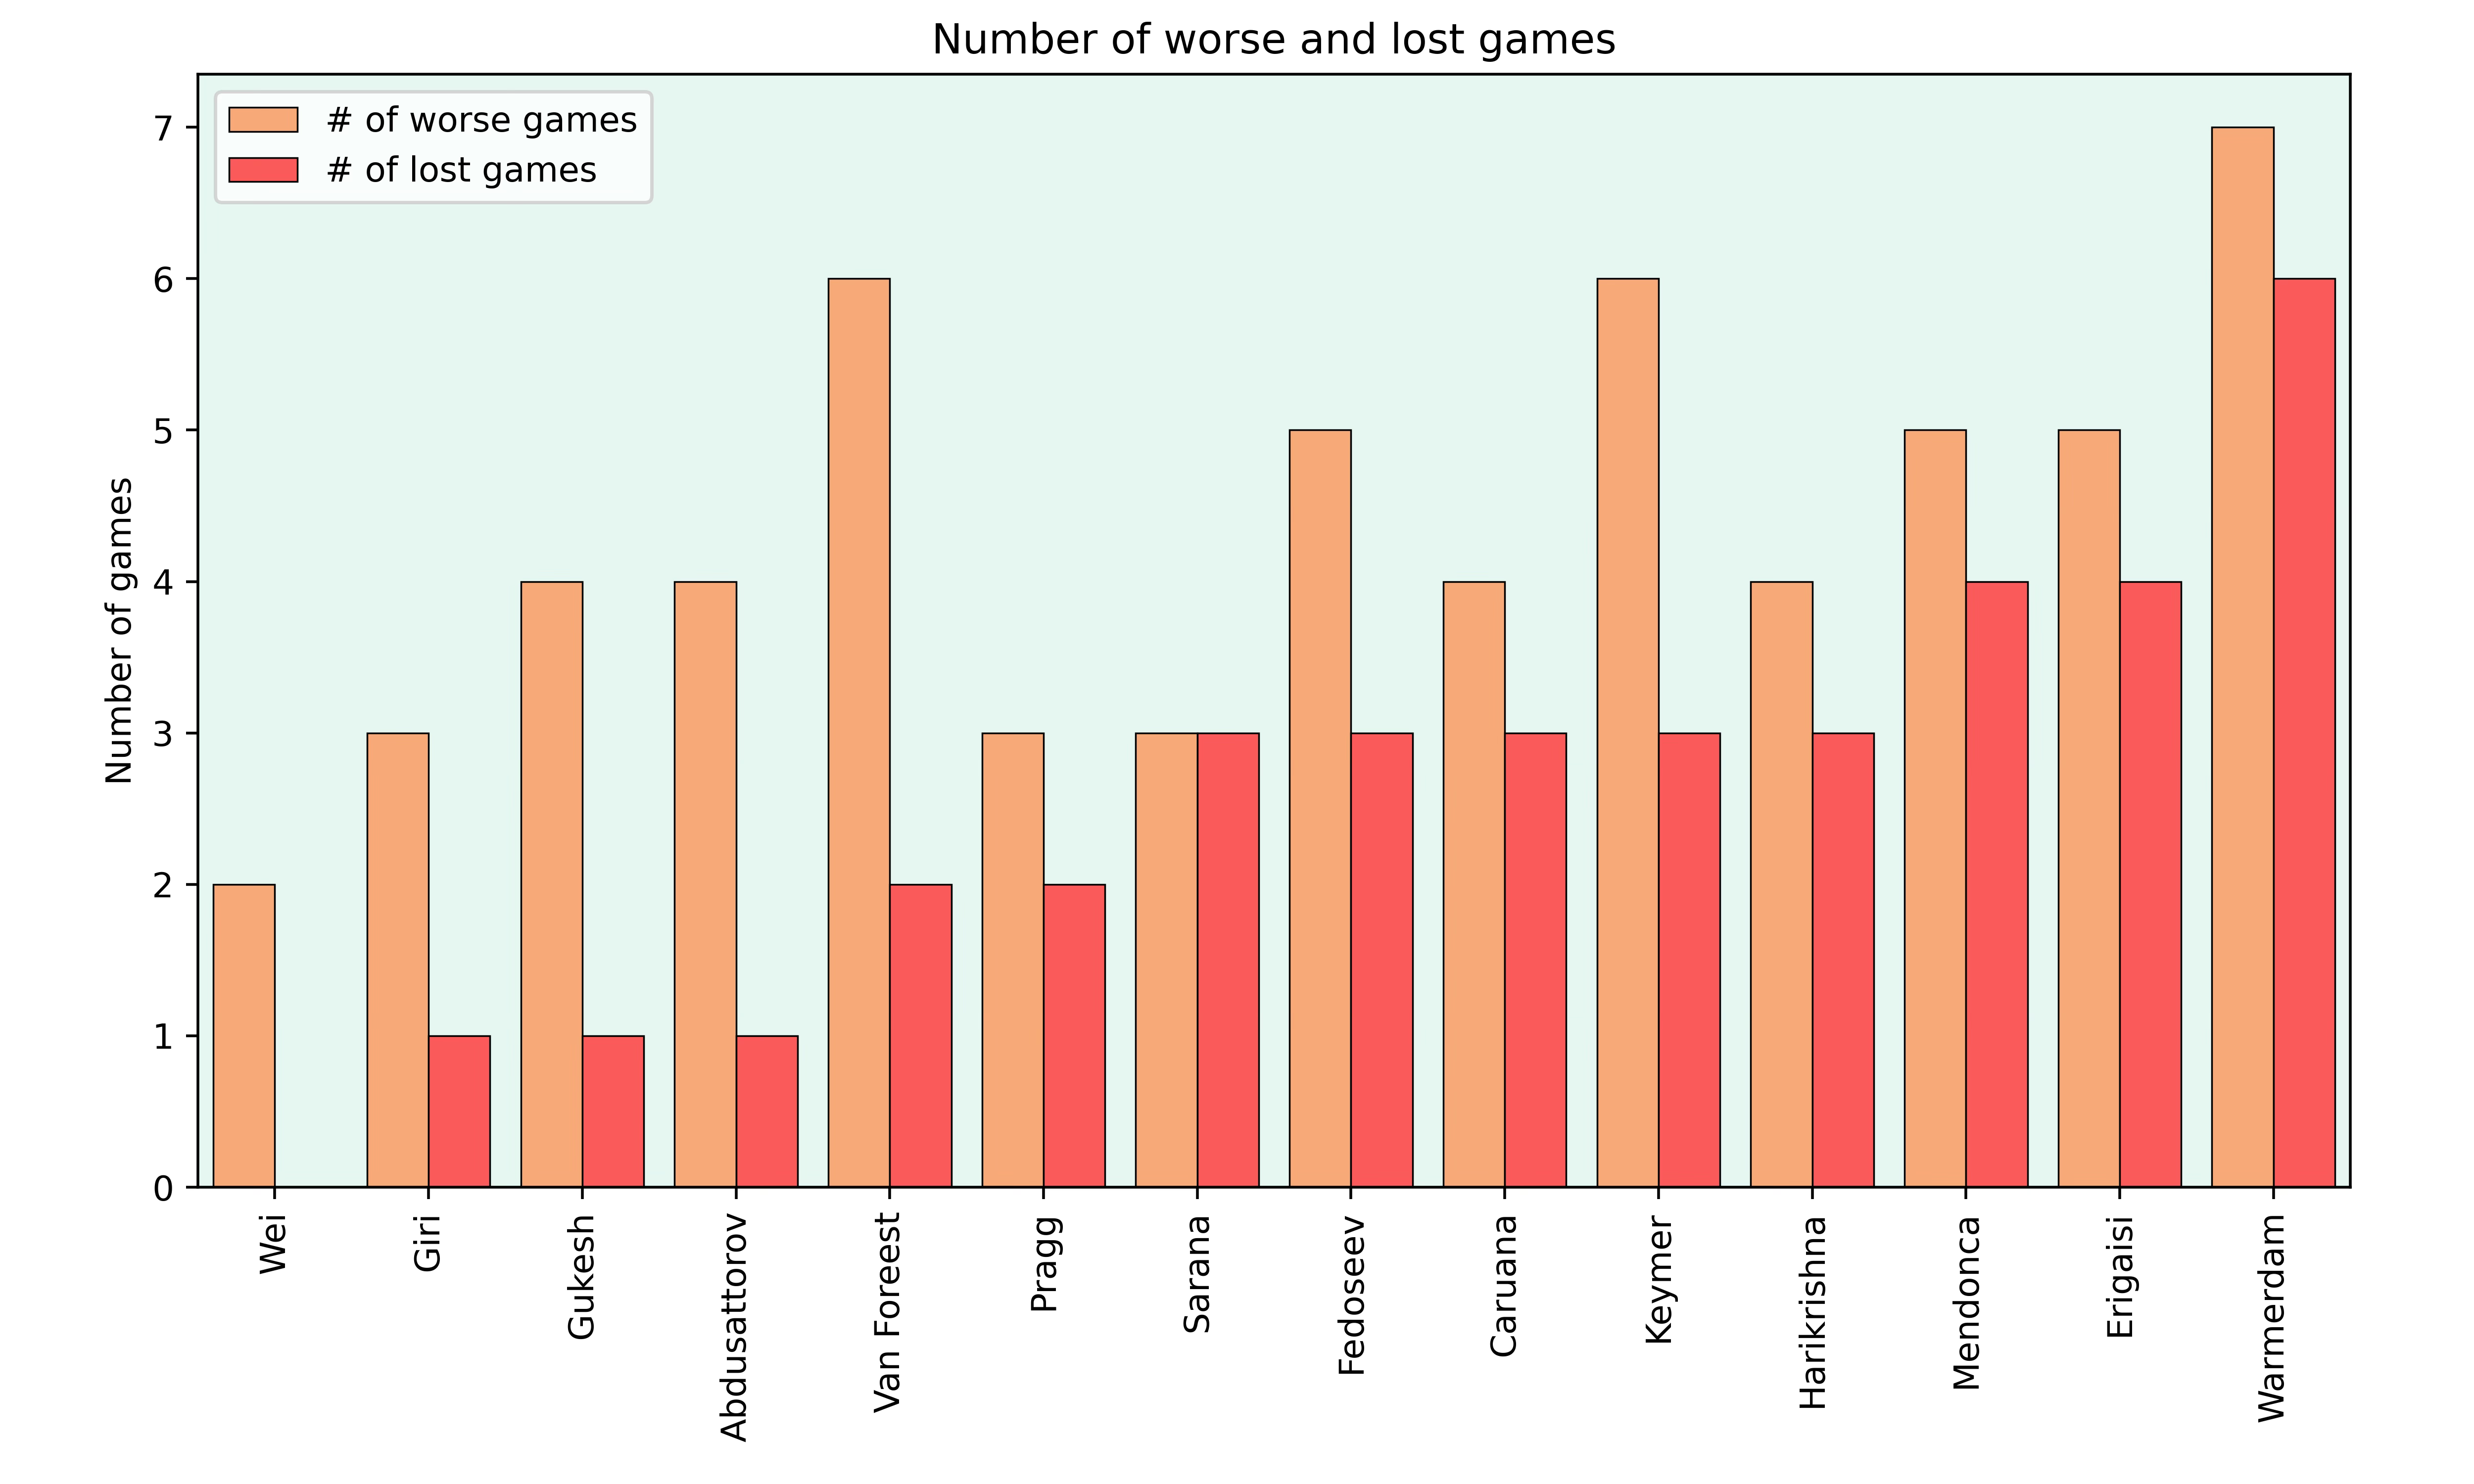
Pragg also got less often in trouble than Gukesh and Abdusattorov but he lost one more game than both of them. The games of van Foreest also seem to have been very interesting, given that he was much better in 5 games and much worse in 6!
Challengers Section
While I didn’t follow the challengers section too closely, I thought that it would also be interesting to look at the graphs from that tournament.
Scores
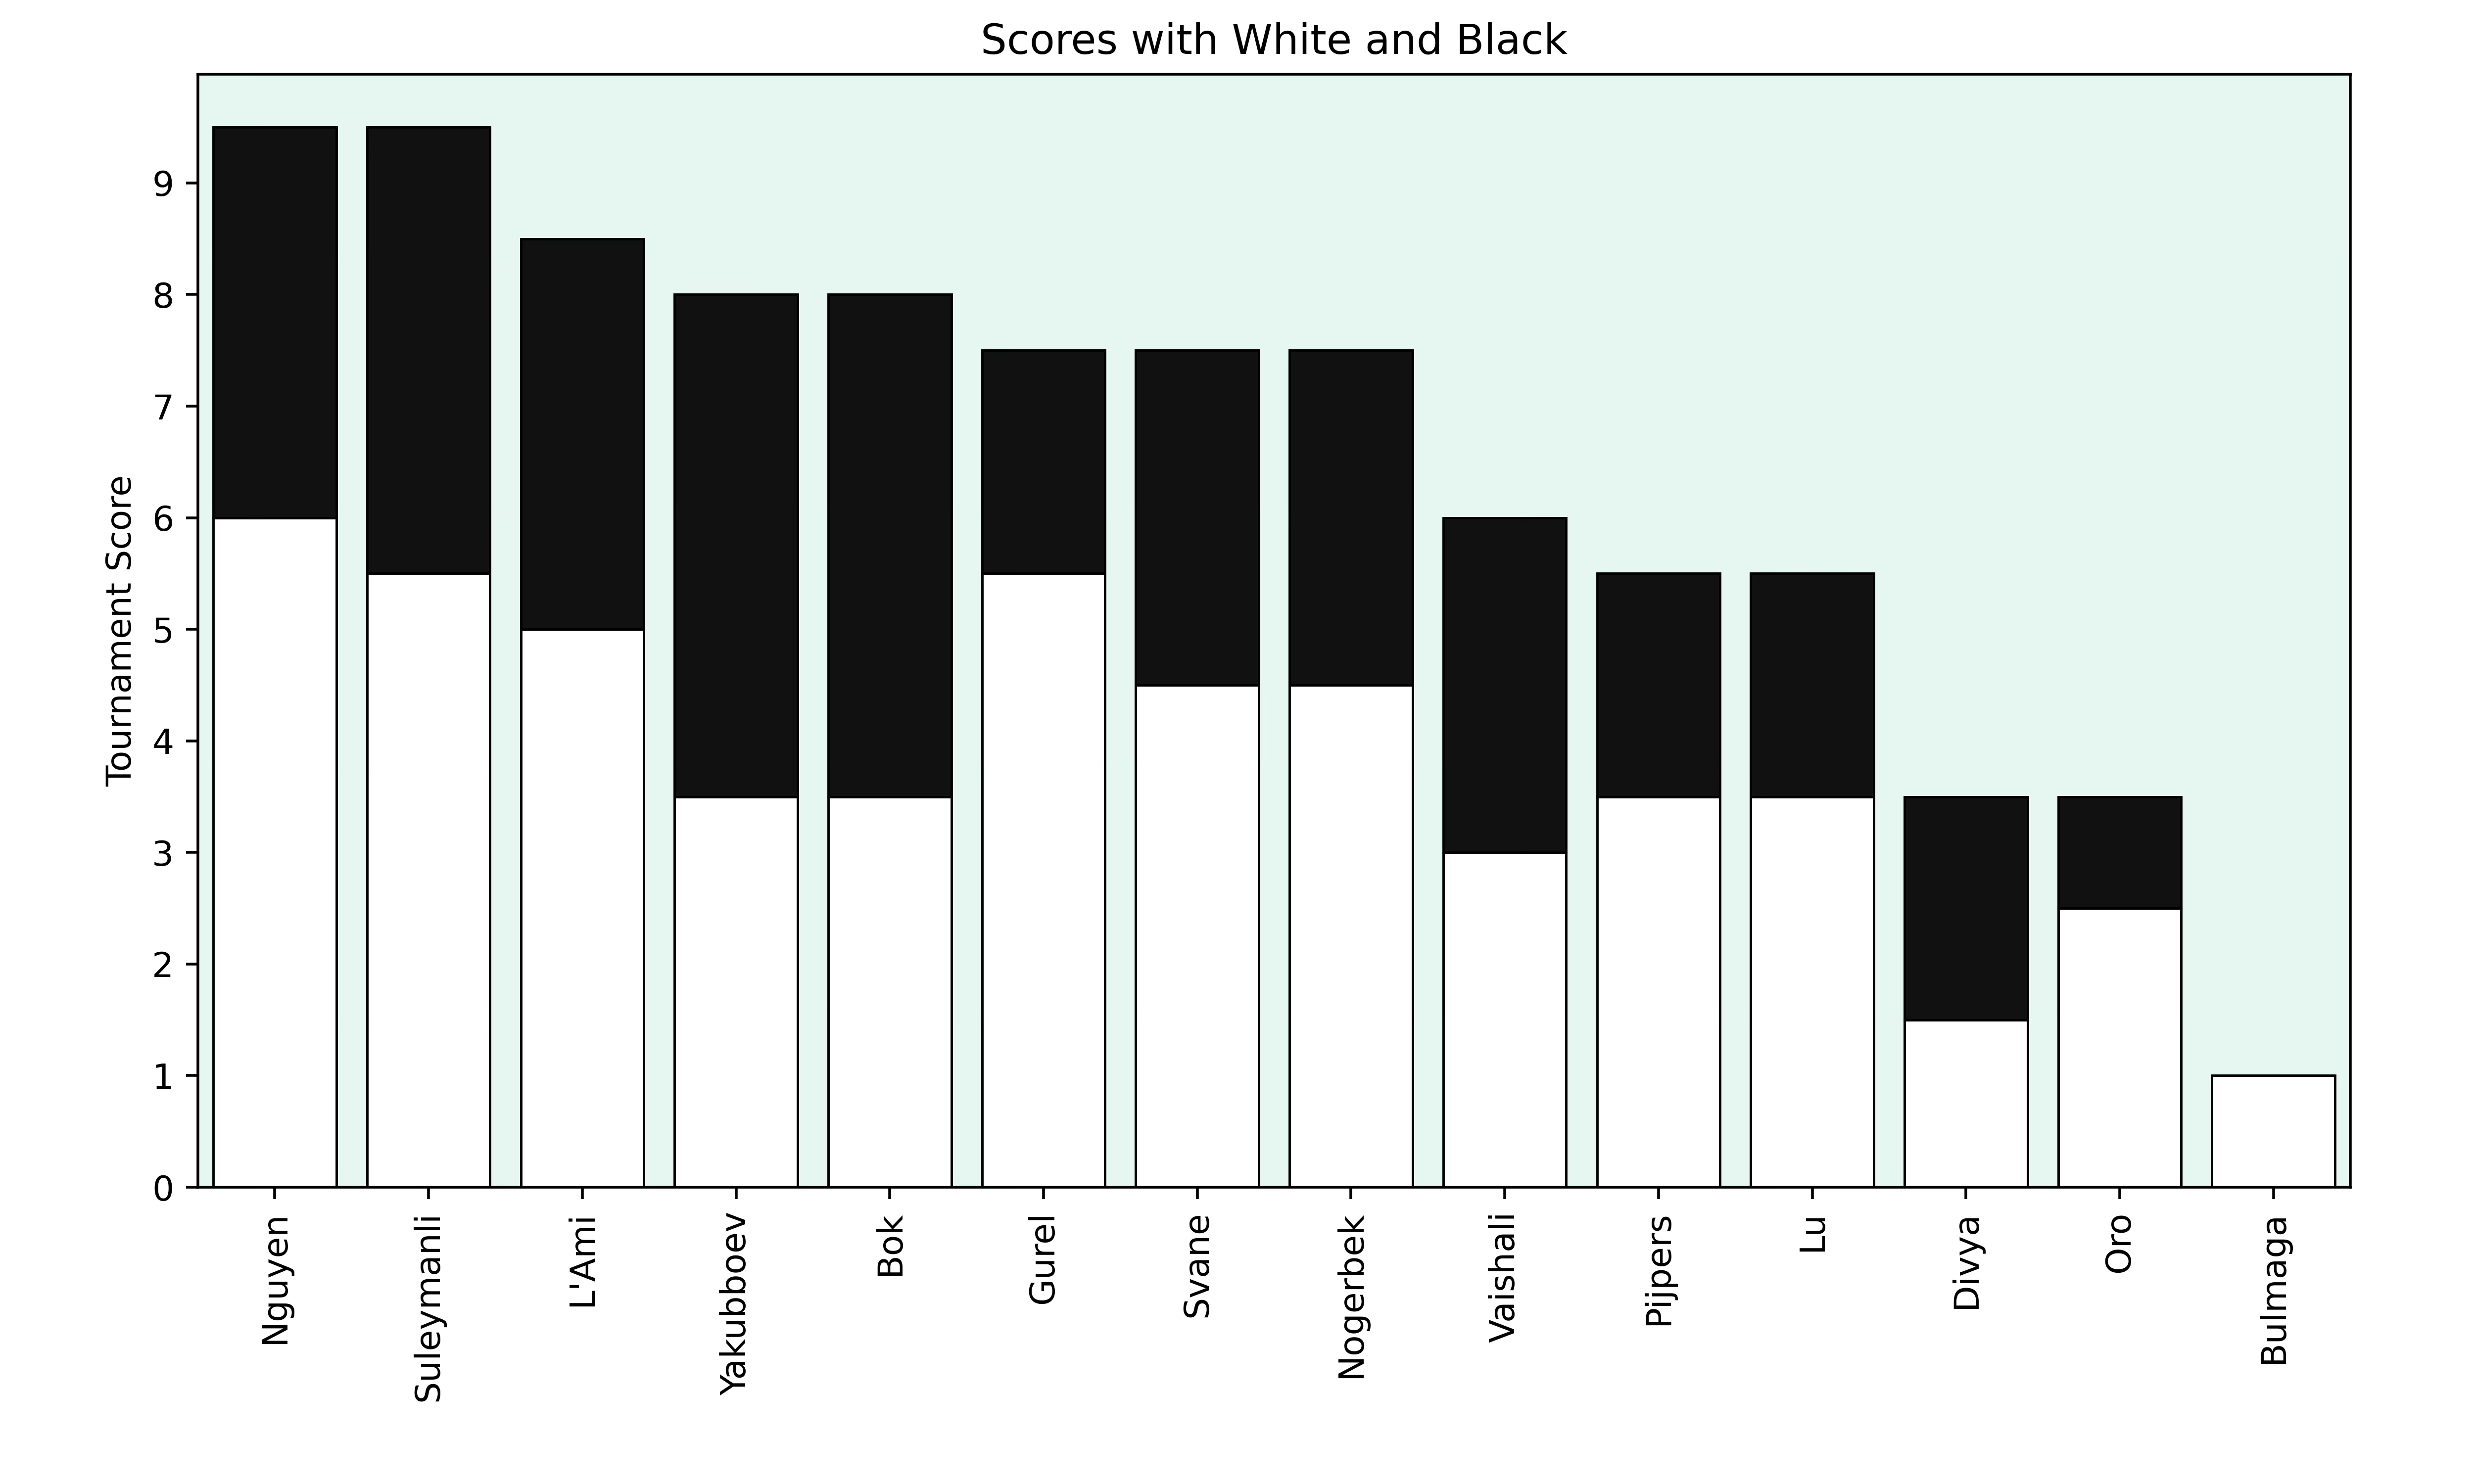
As in the masters section, two players were tied for first place. But since the rating spread was much bigger in this tournament, the two leaders had 9.5 points and some players had a much more difficult tournament.
The fight for first place was also very interesting over the curse of the tournament.
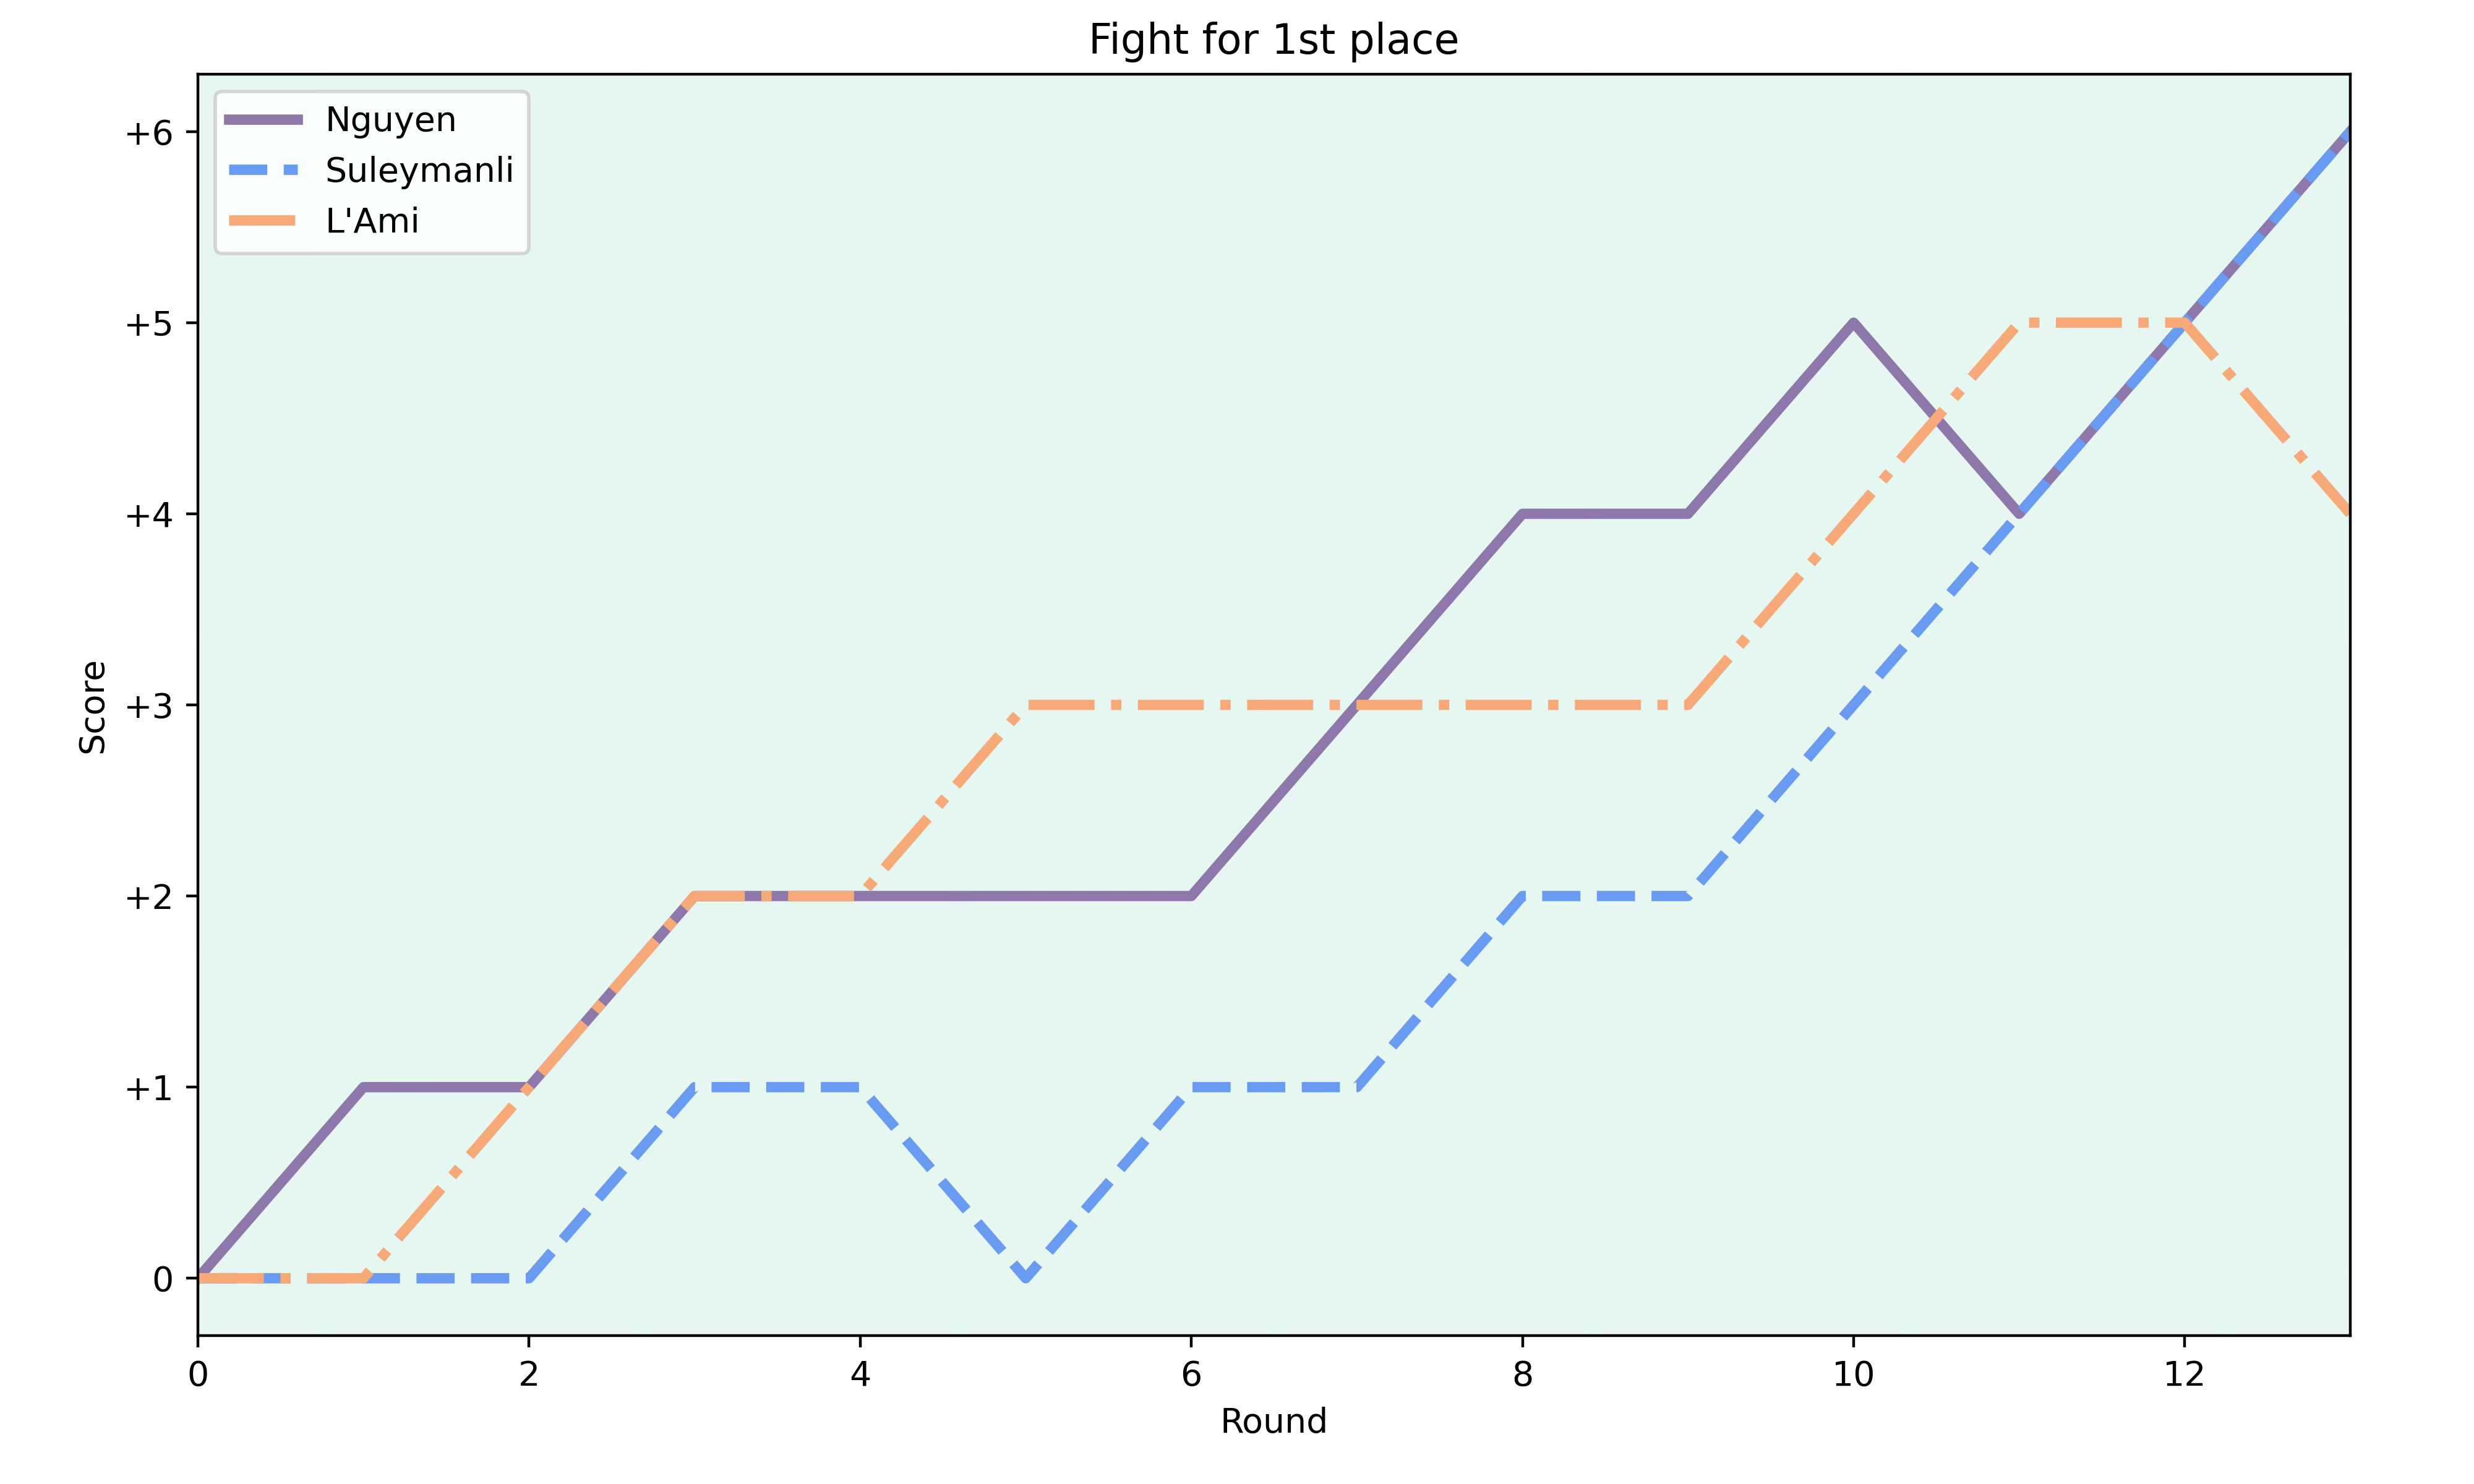
Suleymanil was actually only on 50% after round 5, but he scored an incredible 7 points in his last 8 rounds to catch up to Nguyen. Unlike the masters section there wasn’t any tiebreak match and Nguyen won the tournament by having a slightly better Sonneborn–Berger score and will play in the masters section next year.
Engine Analysis
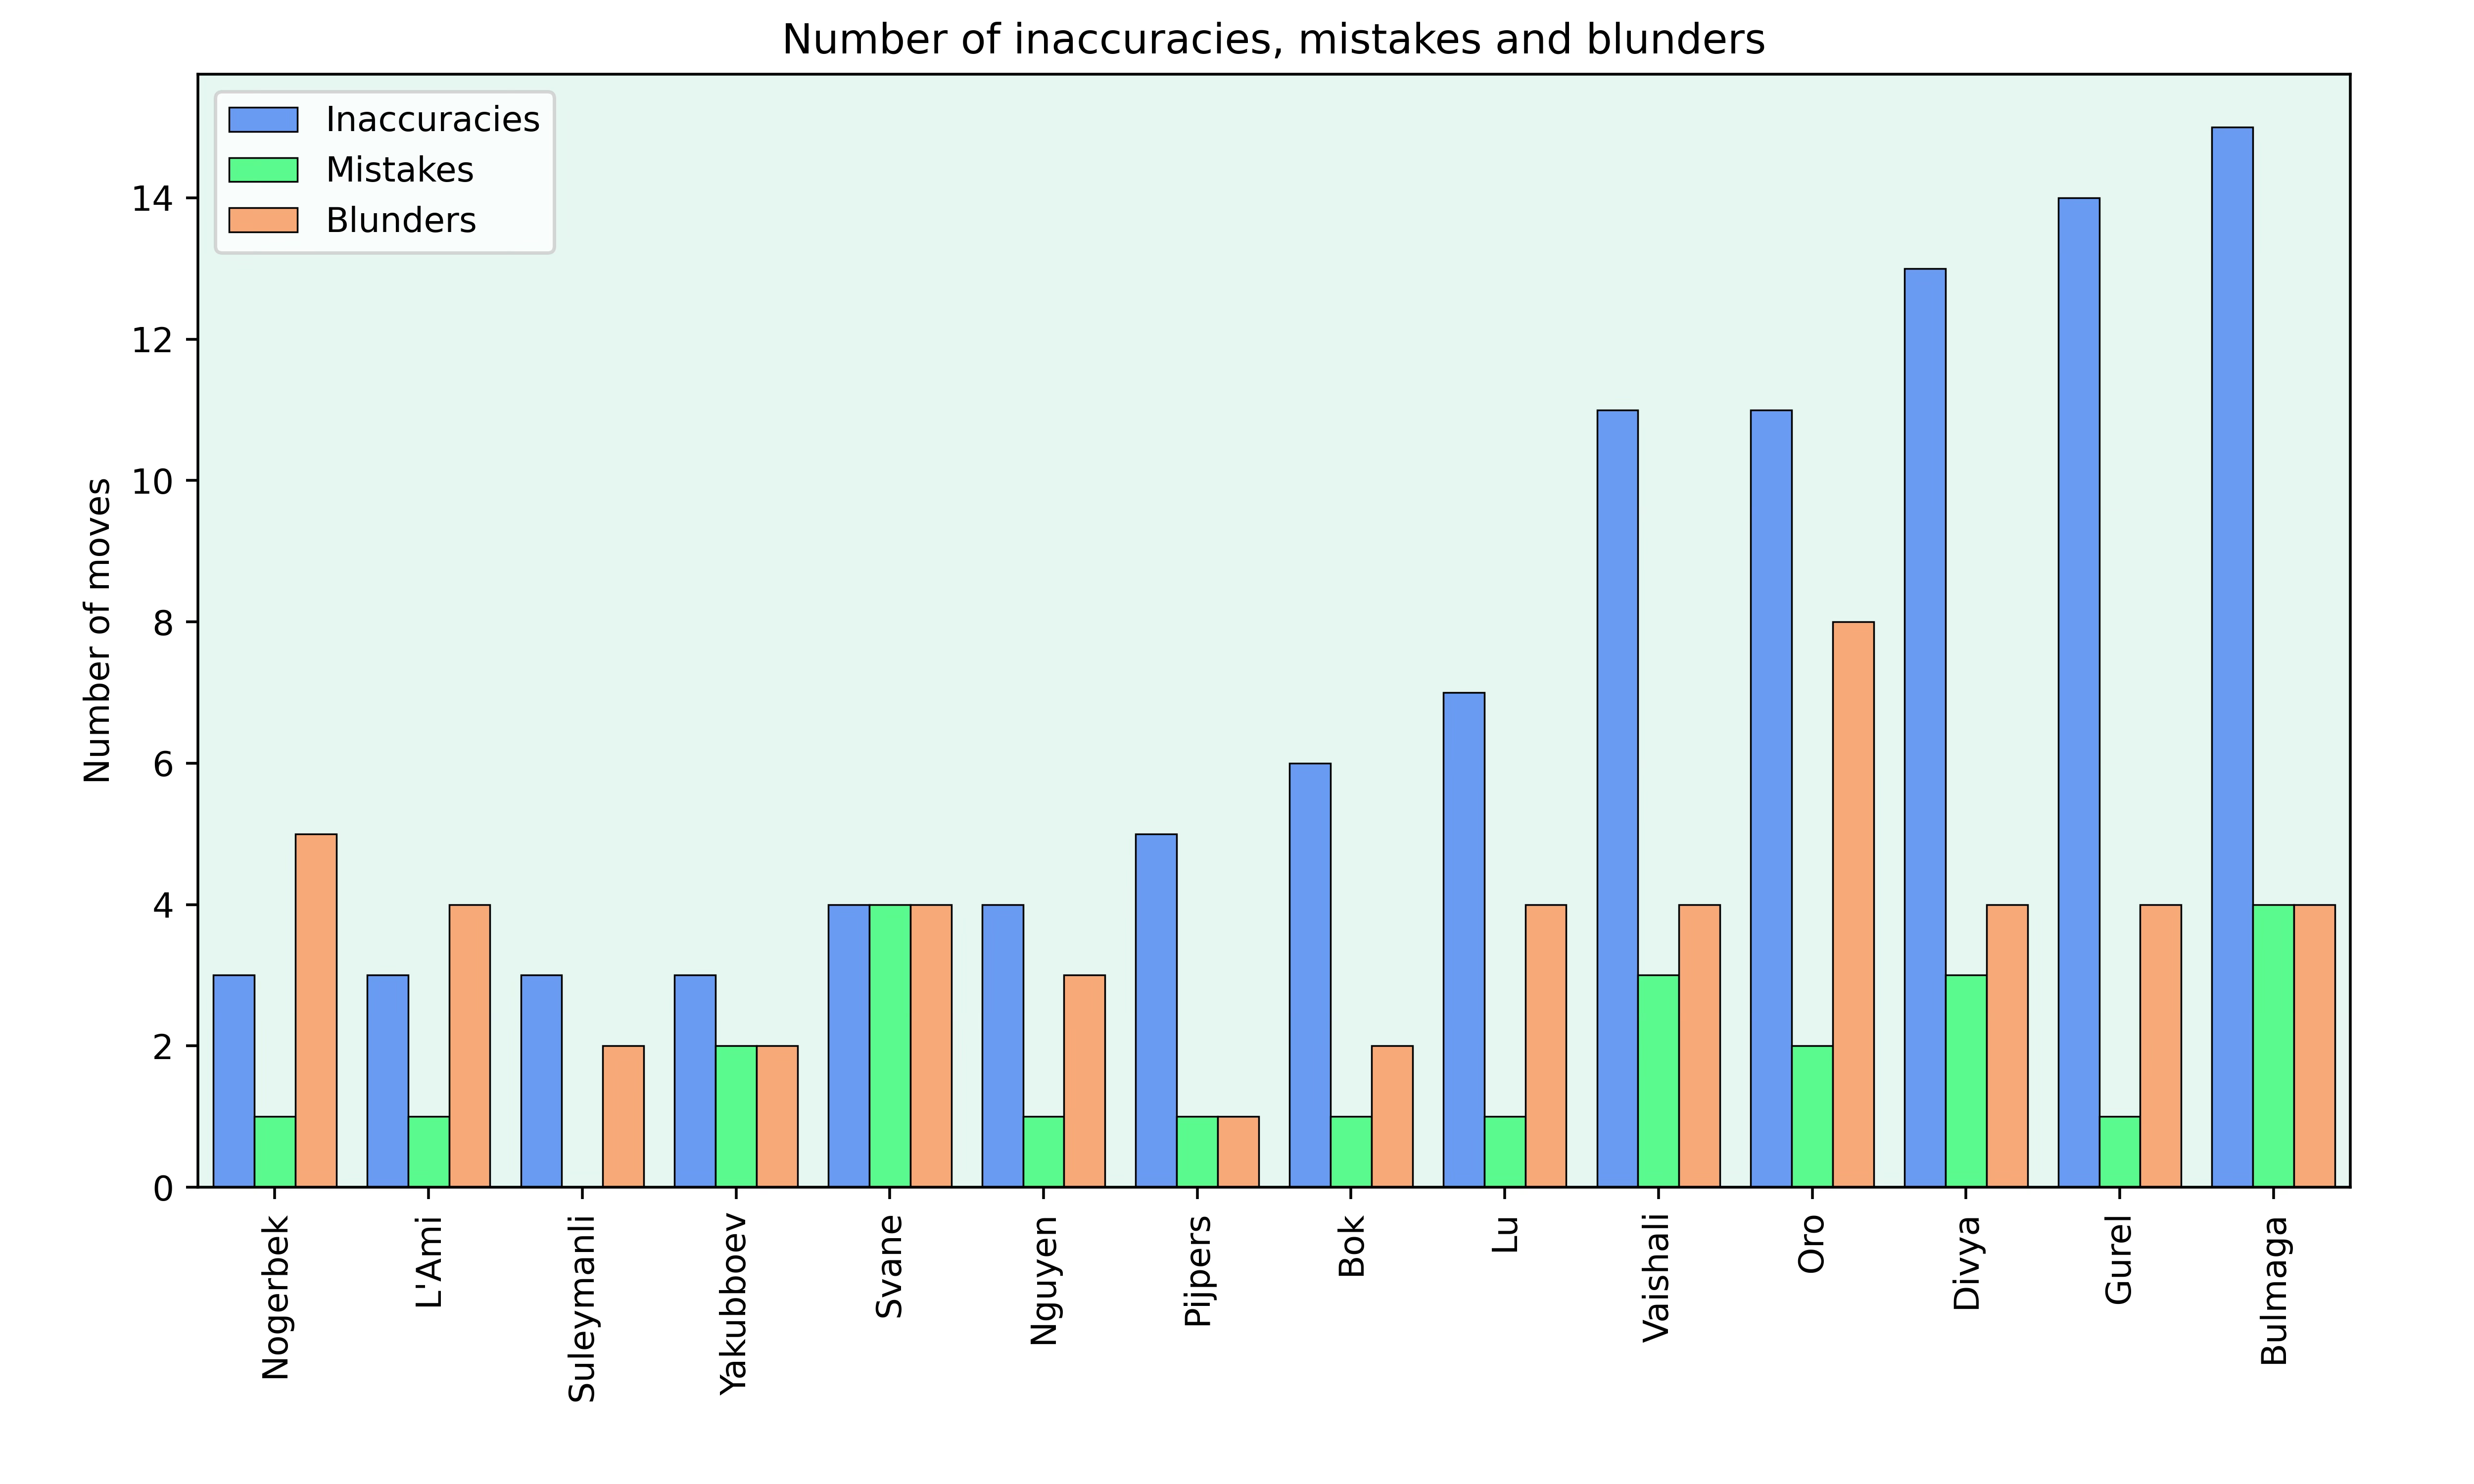
As one can imagine, there were many more inaccuracies, mistakes and blunders in the lower section.
The overall game accuracies were also lower.
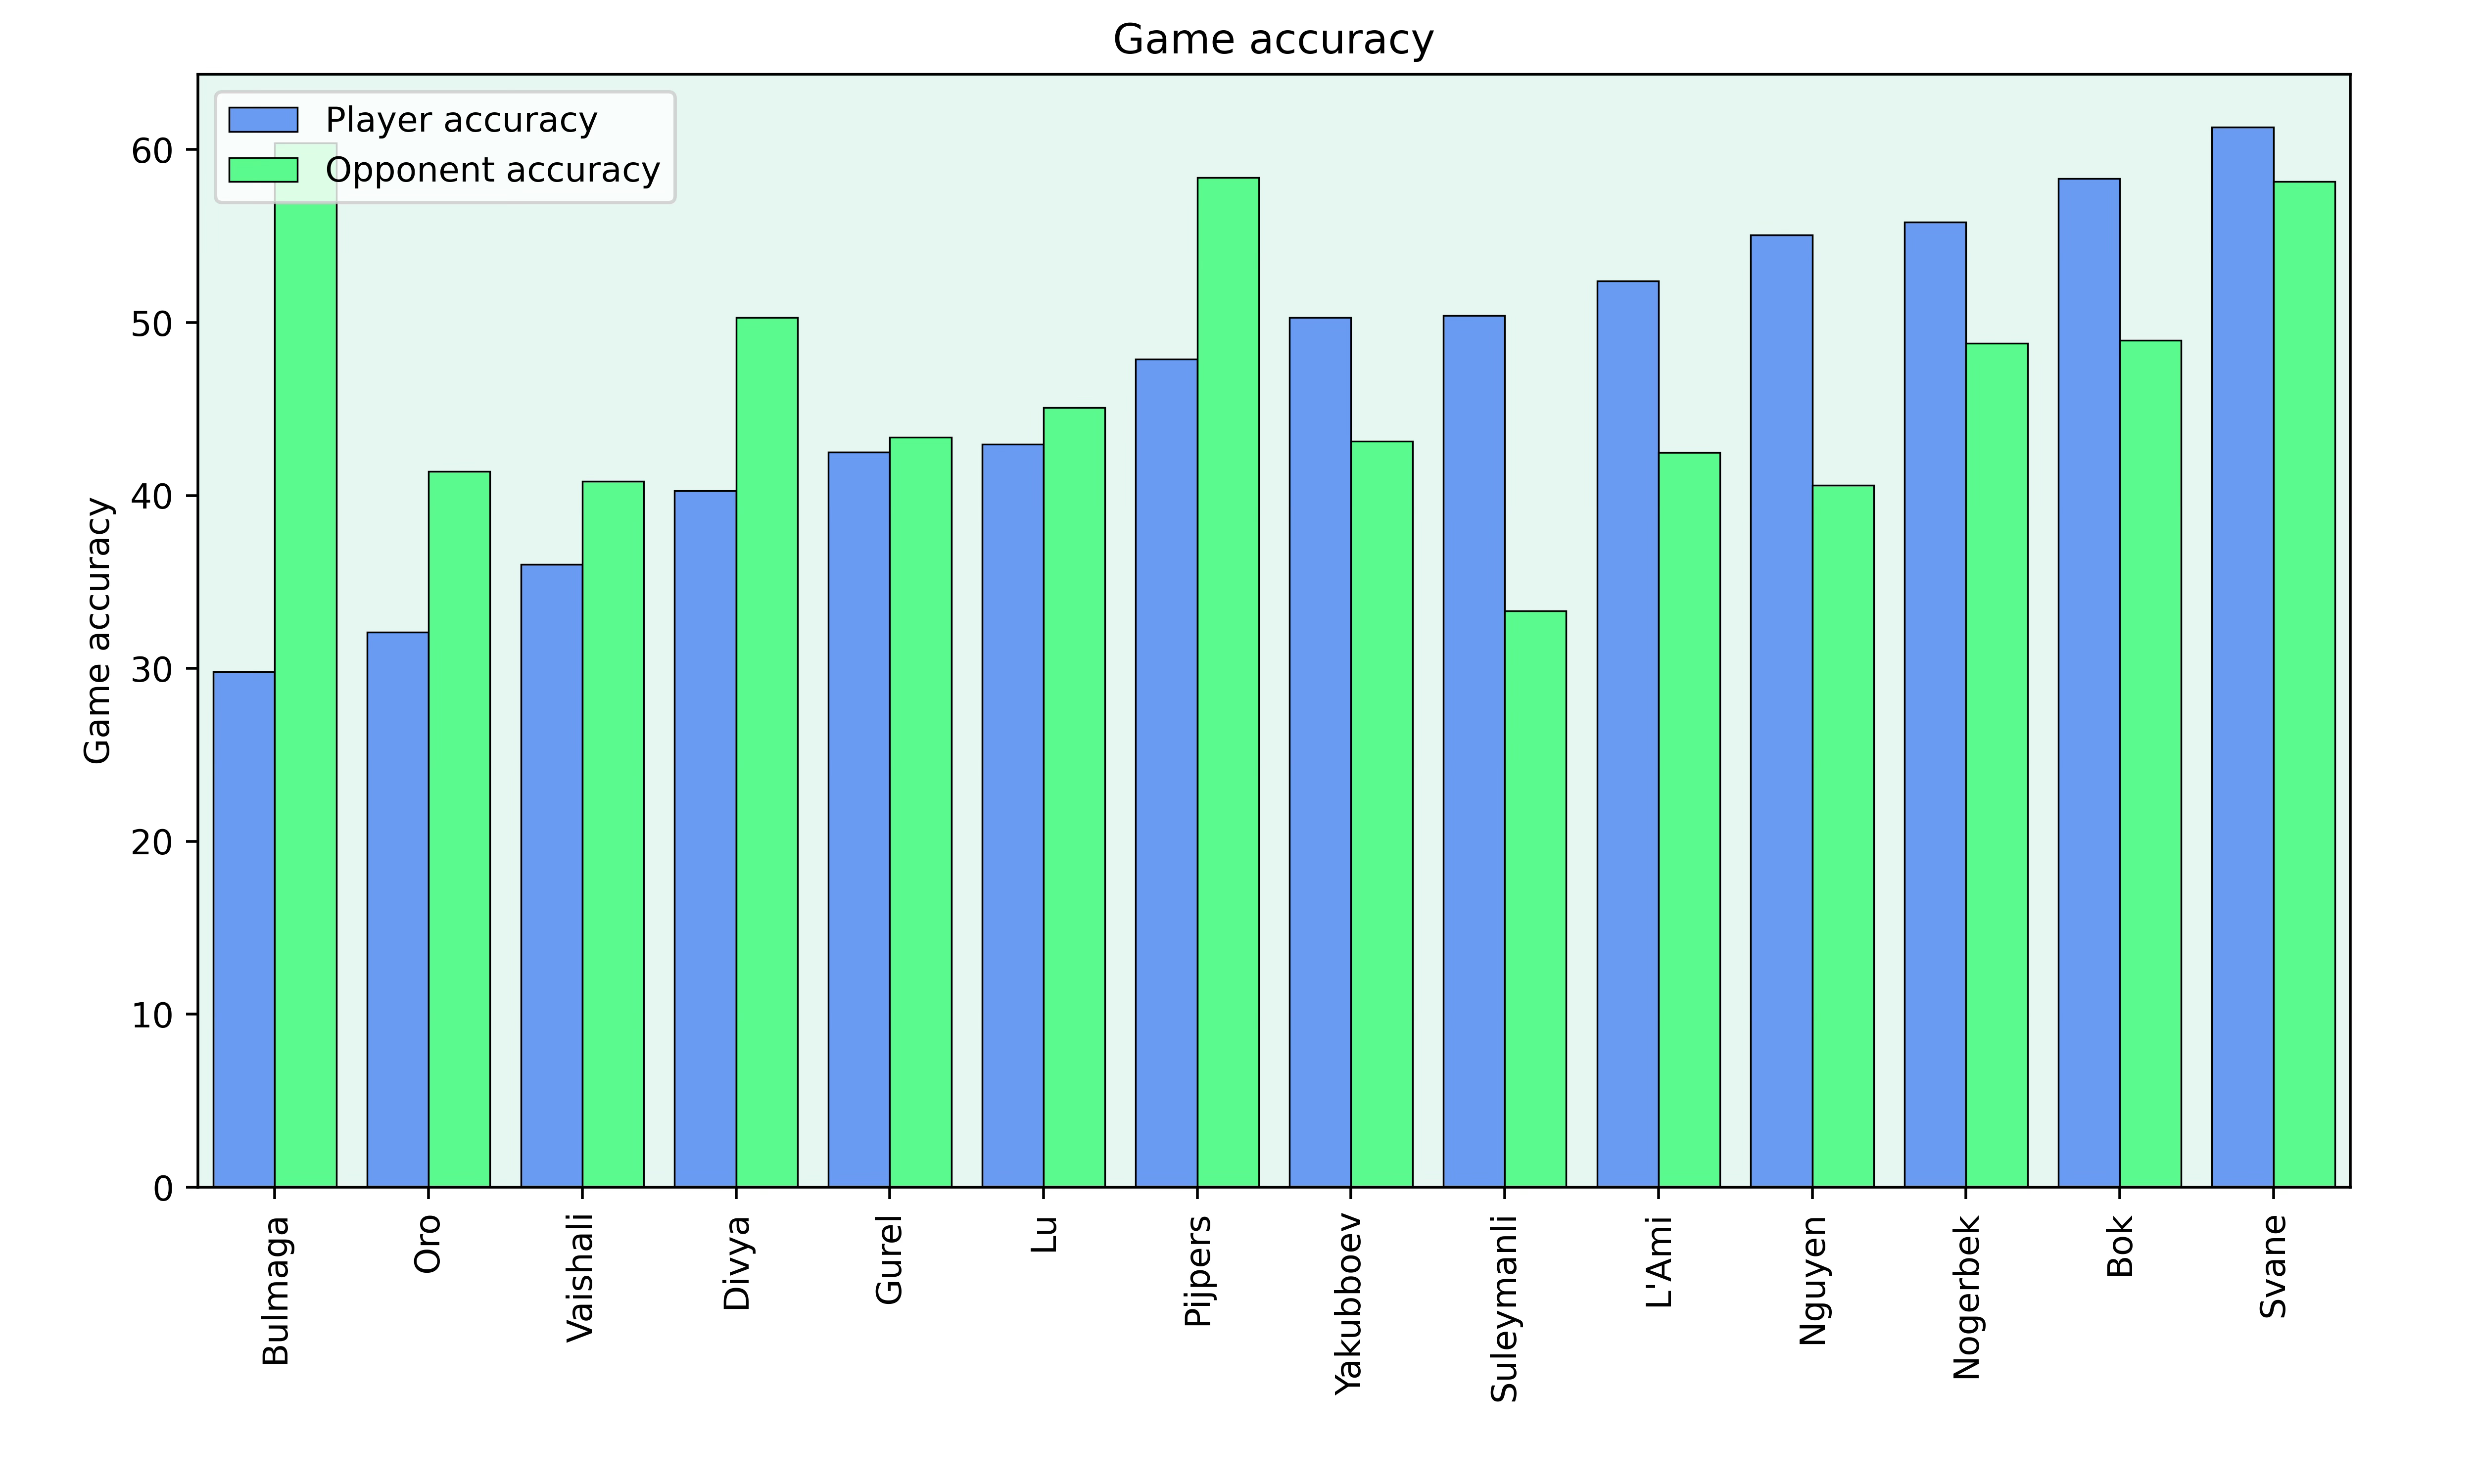
Again it can be seen that the two top finishers didn’t play the most accurate chess, but they were much more accurate than their opponent’s in the games. This graph also shows also how well Lu Miaoyi played, given that she was the second lowest rated player in the tournament.
Better and Worse Games
The number of moves where the players were better, equal or worse also varies much more than in the masters section.
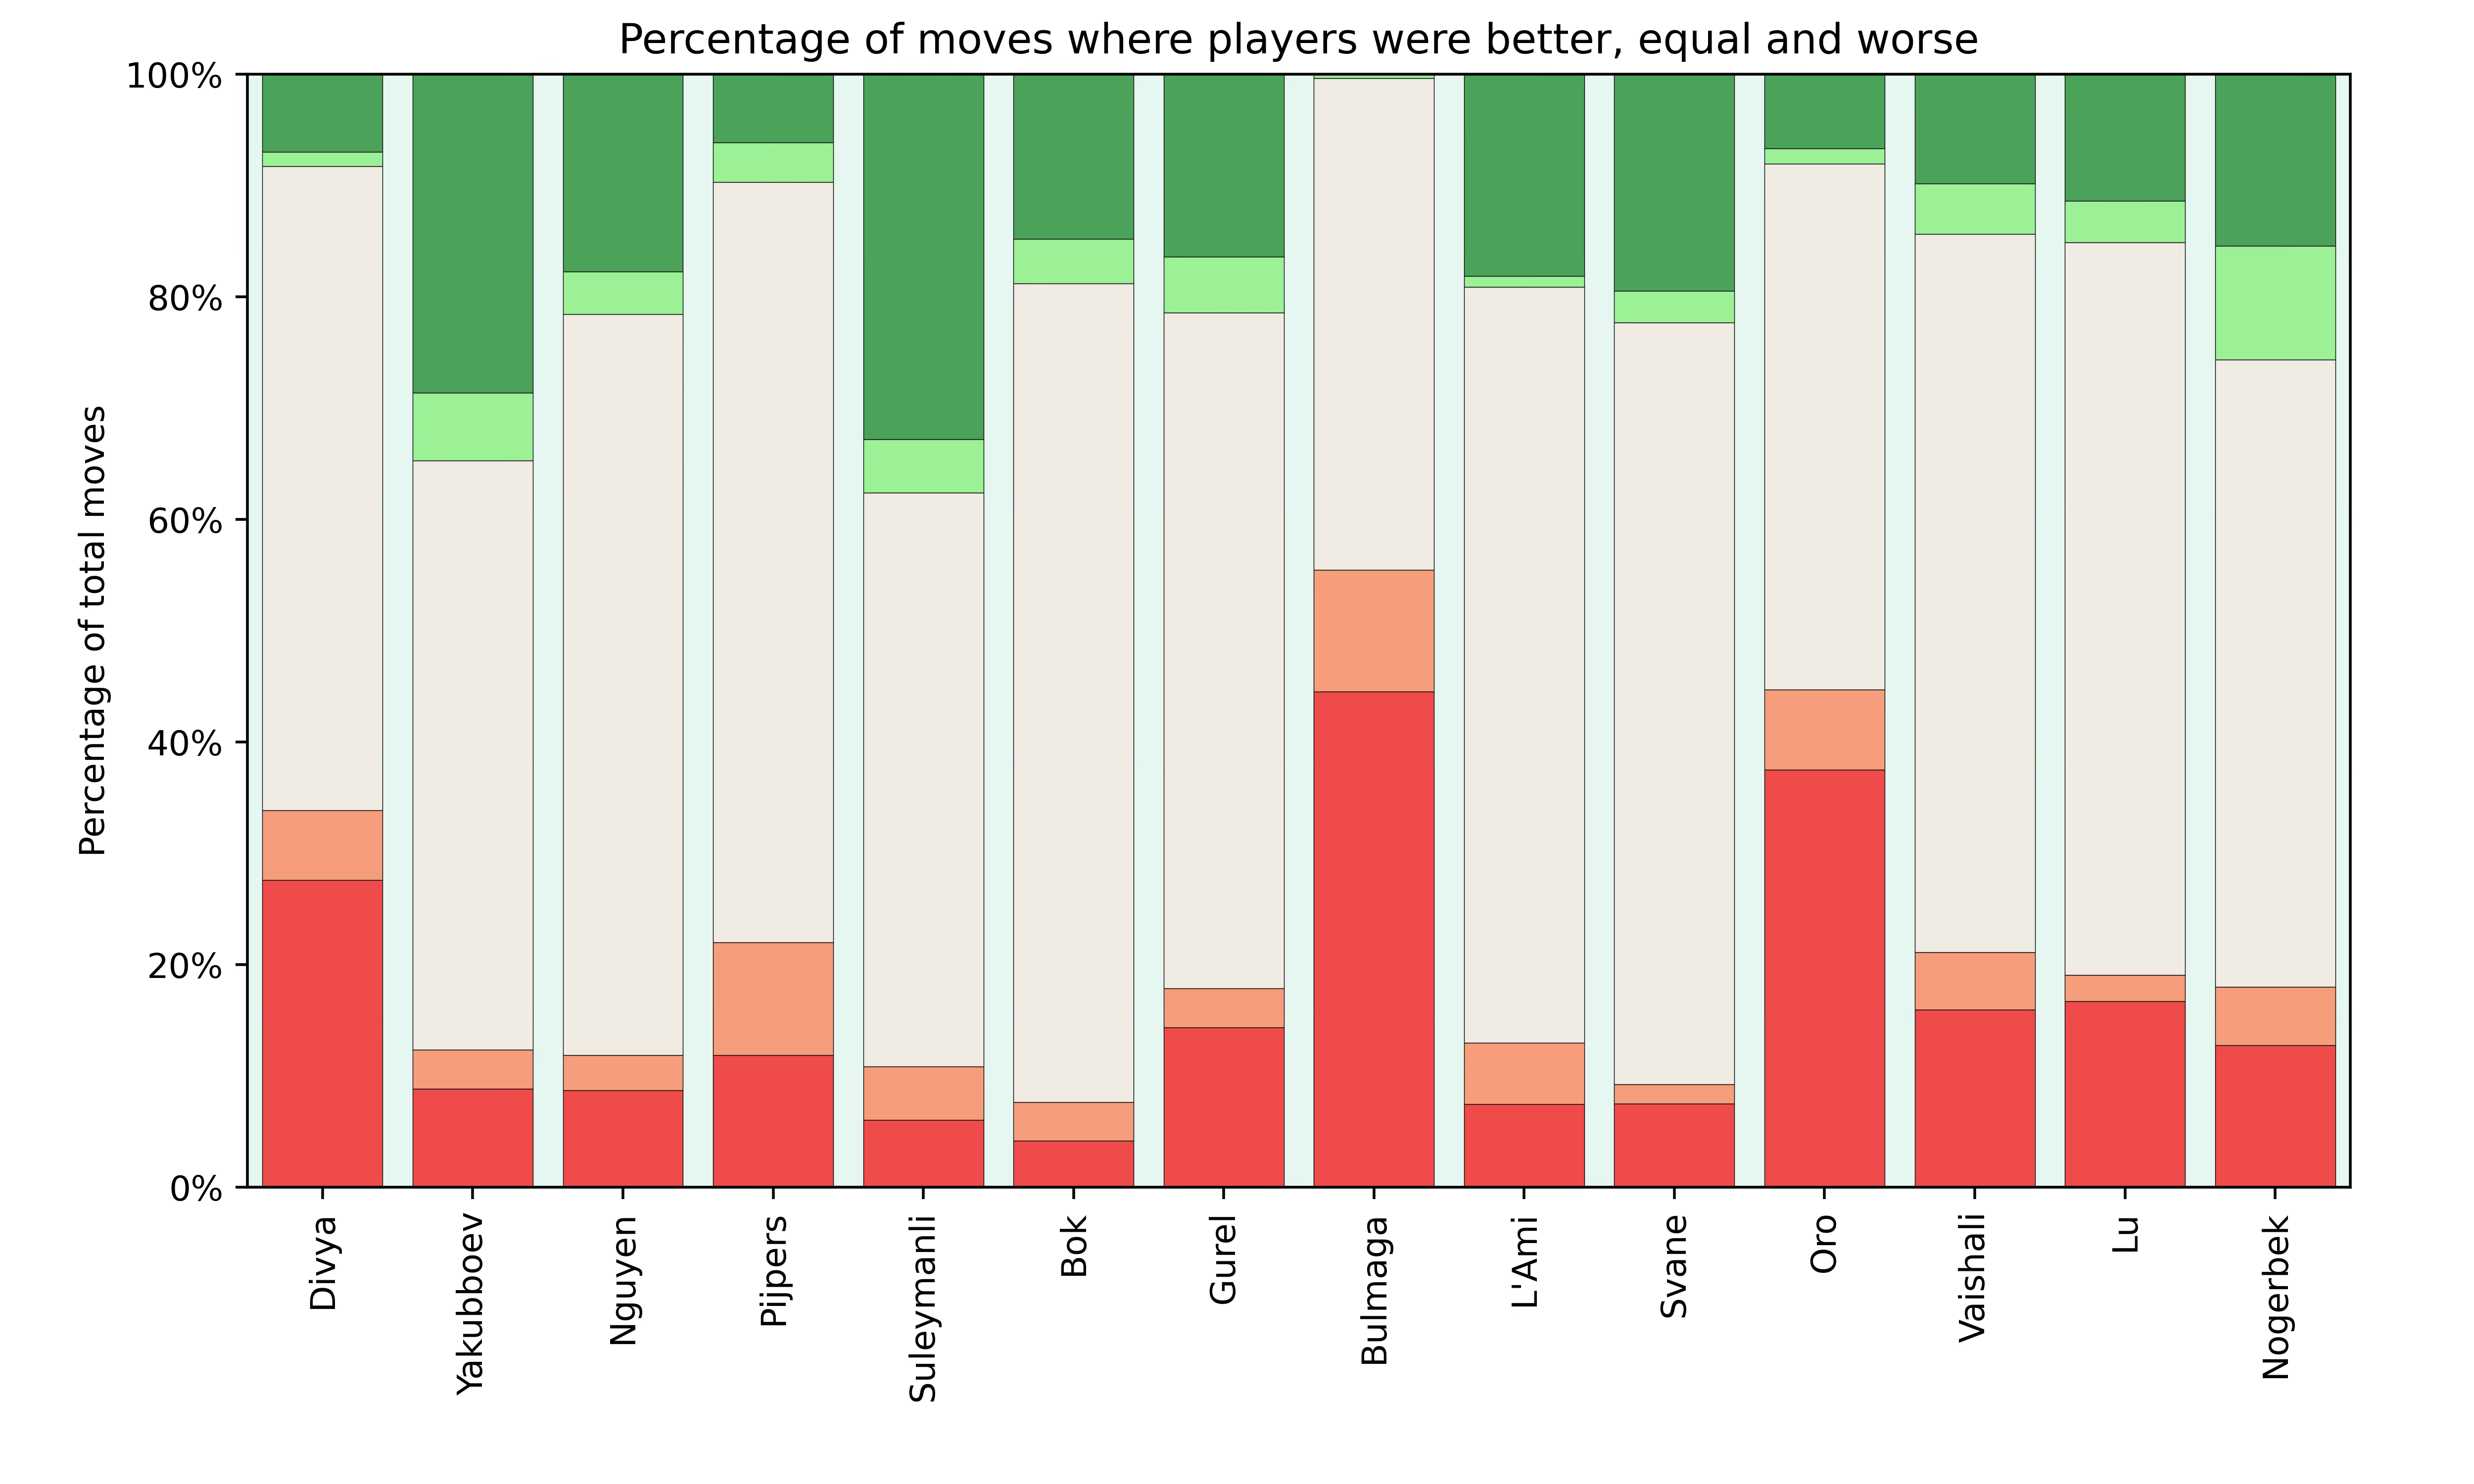
This plot just highlights how difficult this tournament was for Irina Bulmaga who had a worse position for nearly half her moves and was never standing better. The youngster Faustino Oro also had a difficult time, being one of the lowest rated players in the tournament.
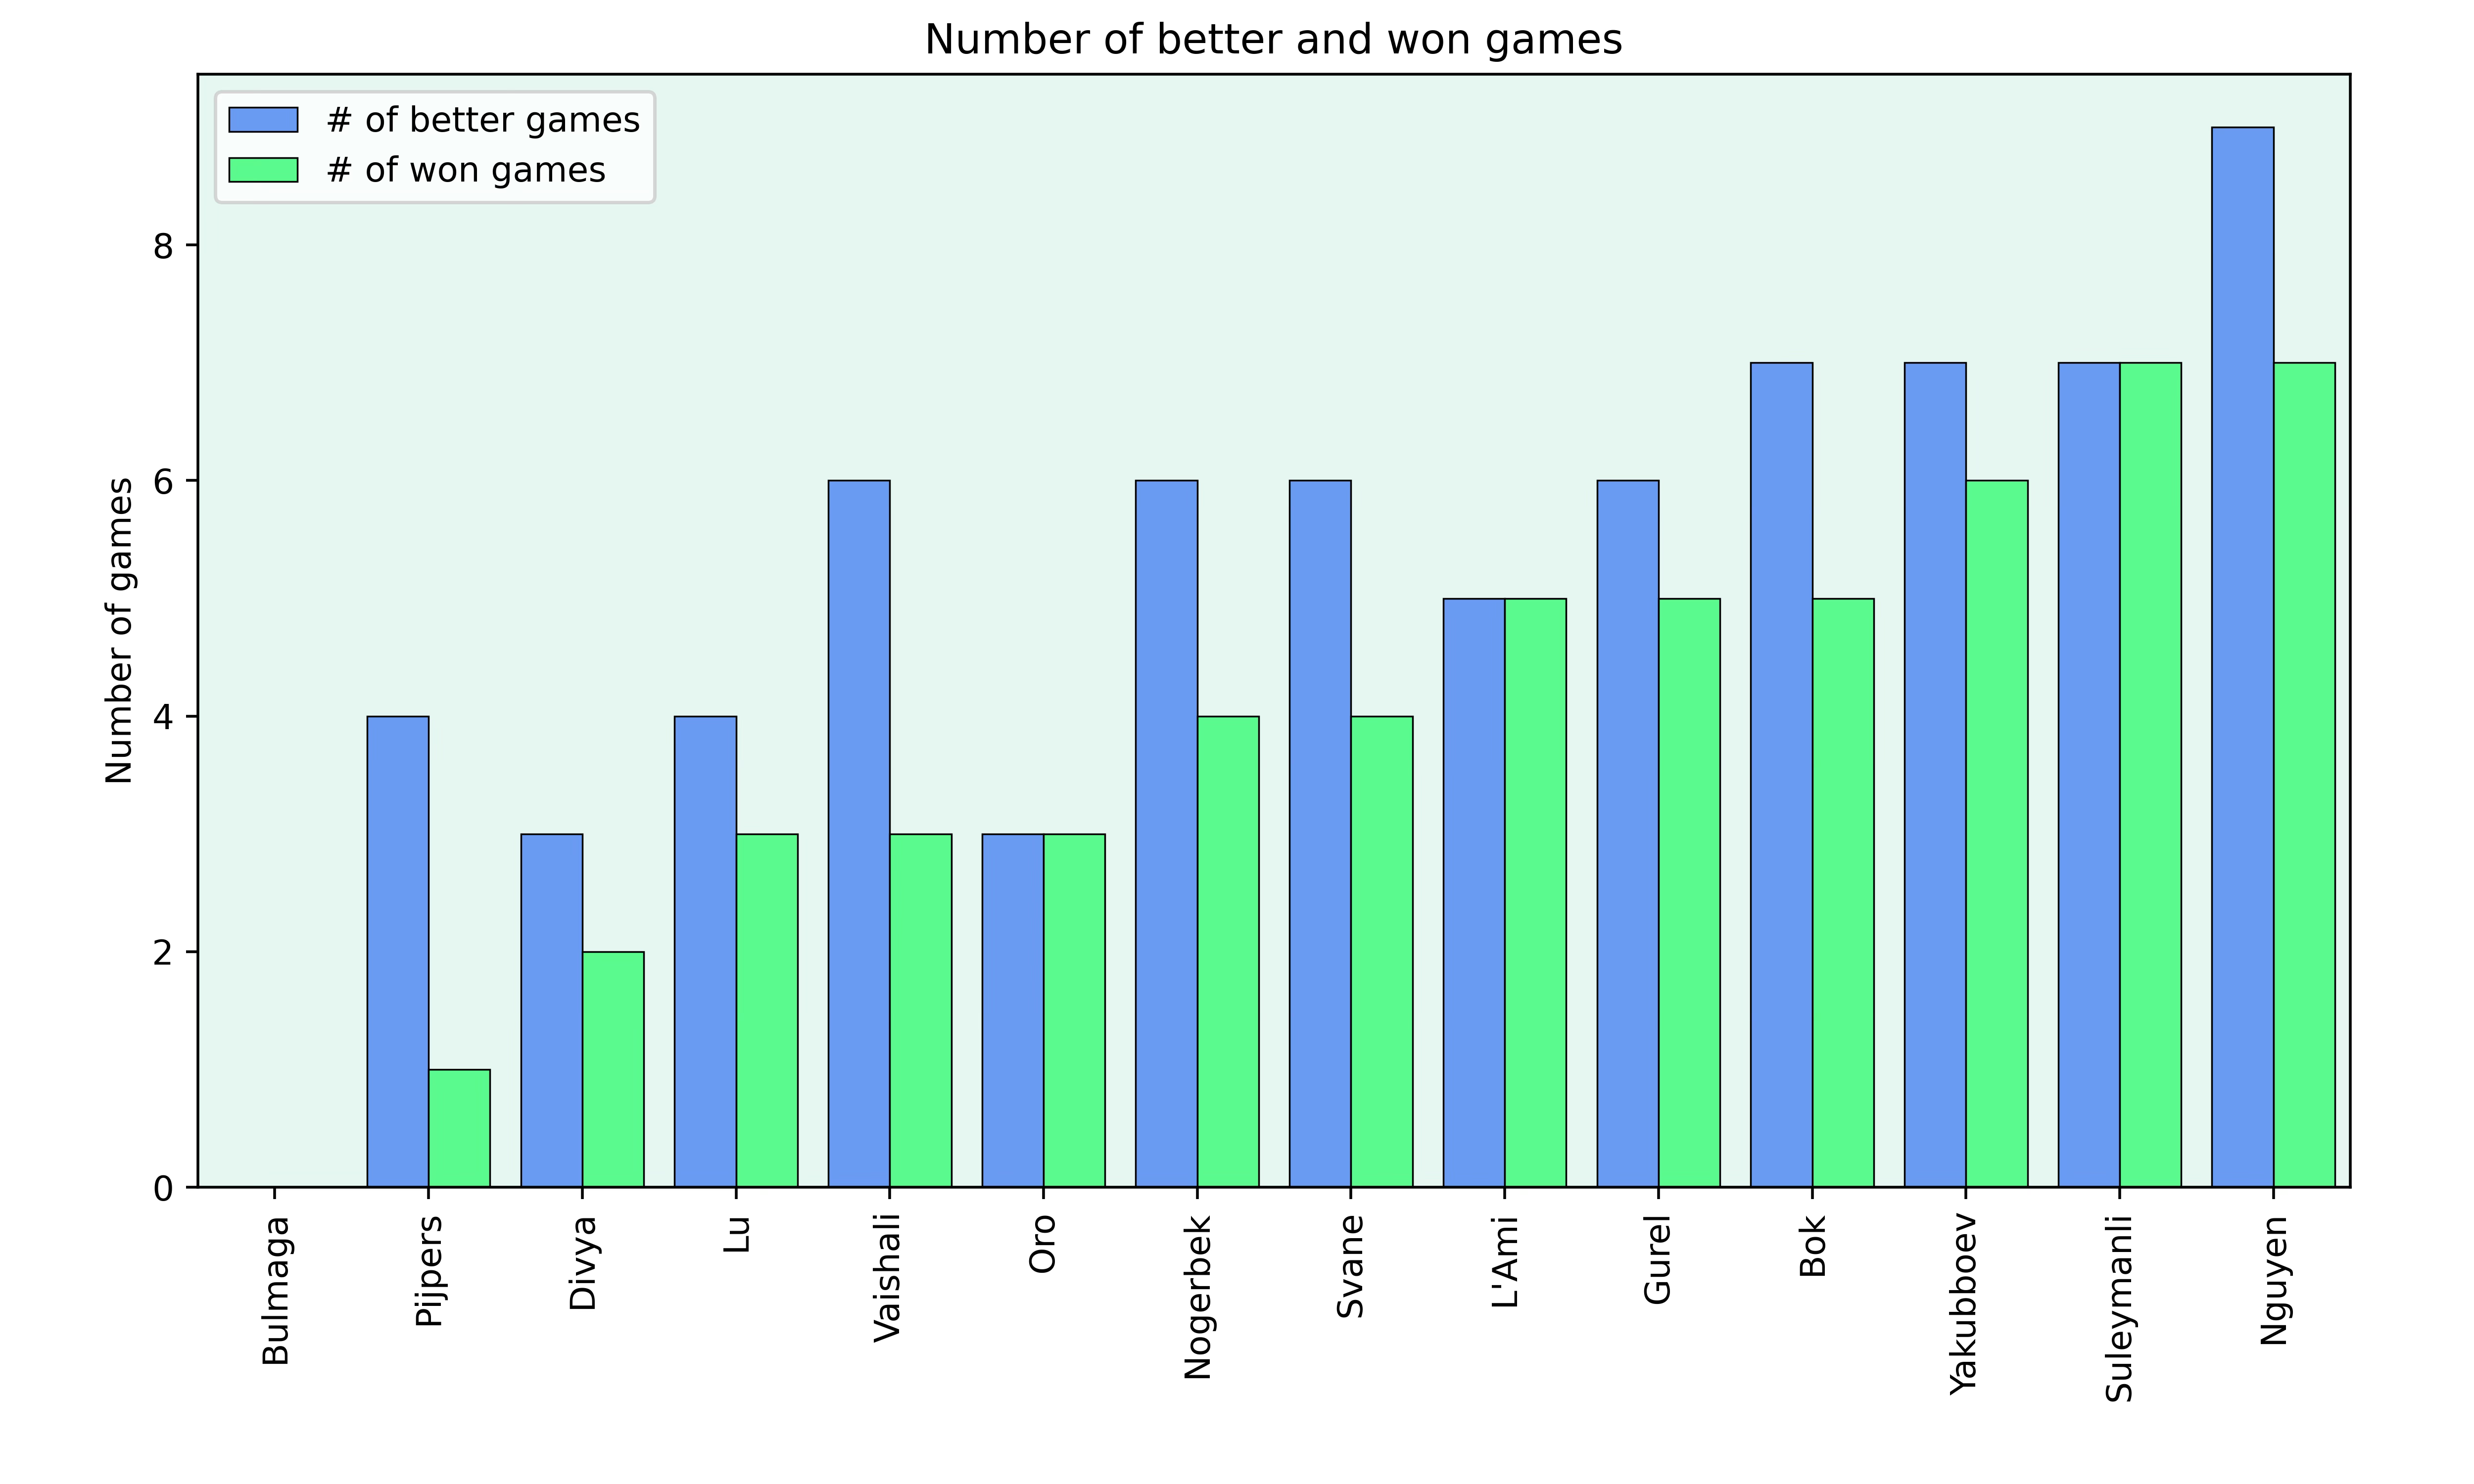
It’s interesting to see that Suleymanli was very efficient in using his chances while Nguyen could have actually scored even more points given the positions he had. Overall, there weren’t as many missed chances as I would have expected before seeing the plot.
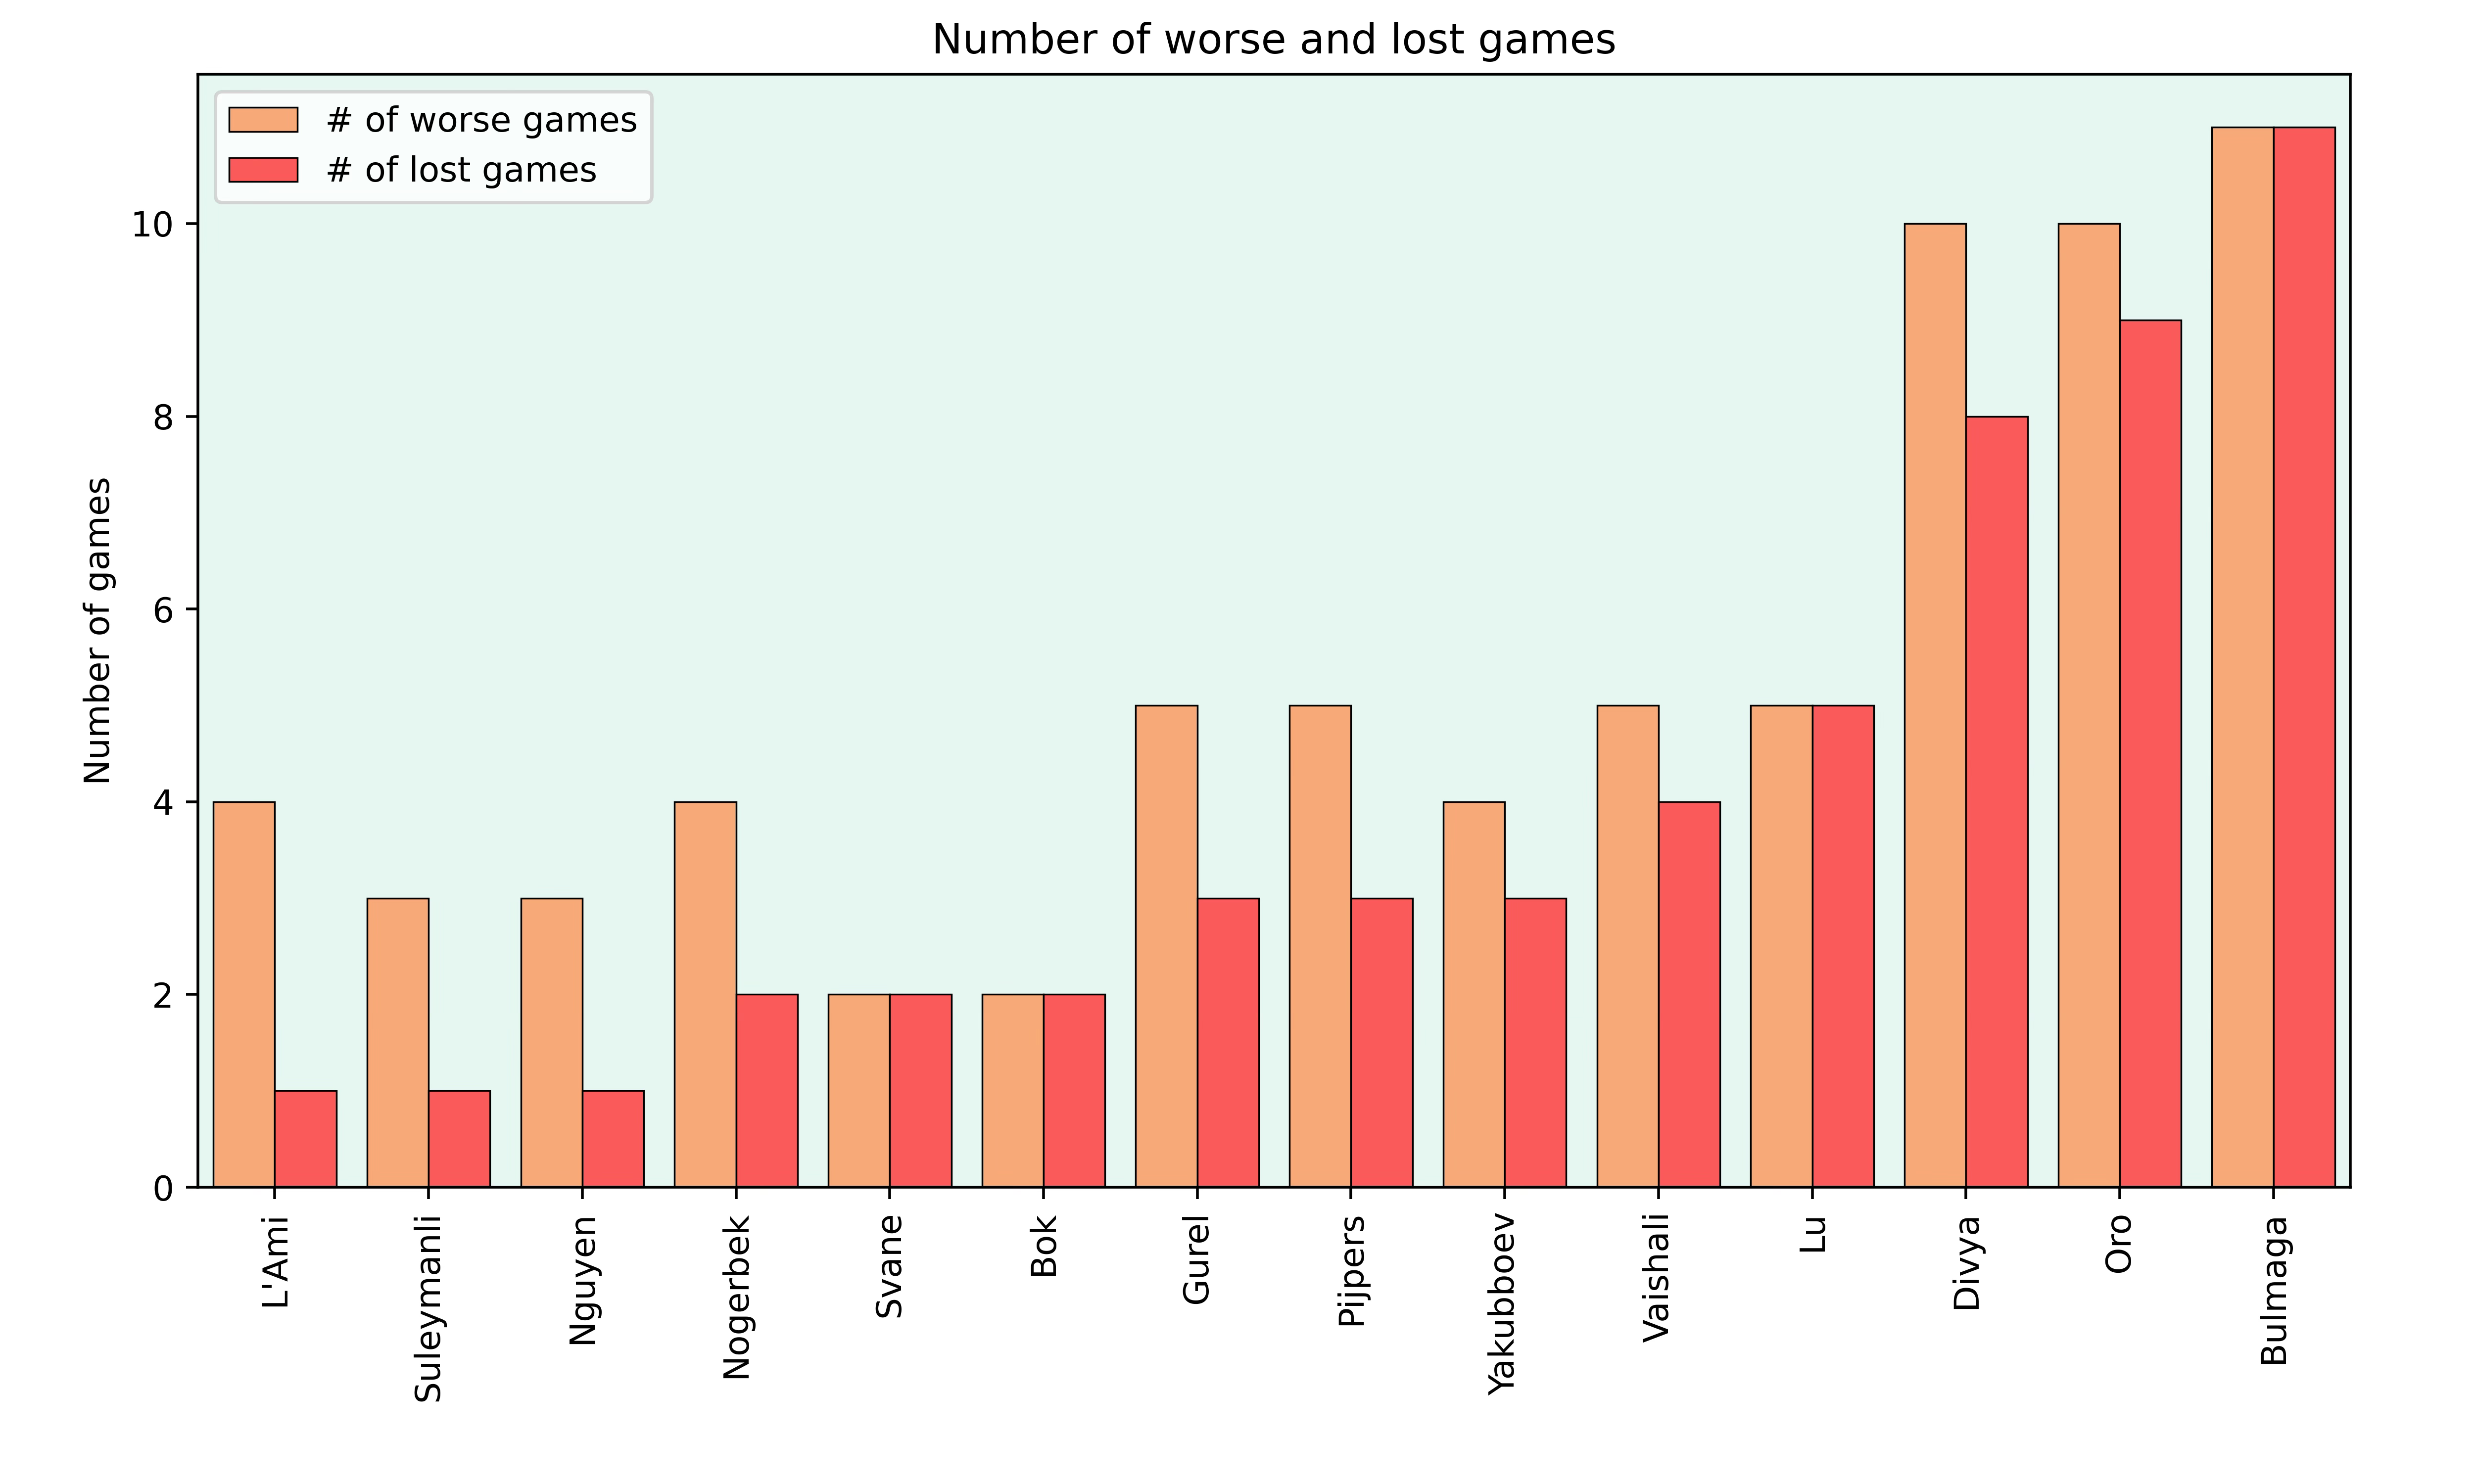
As with the tournament scores, this plot shows once again that particularly the bottom three players had a very difficult tournament. Also L’Ami stands out in having held the most games where he was standing clearly worse at some point.
Conclusion
I hope you found these graphs as insightful as I did. Let me know which stats you particularly liked, which weren’t necessary and other things I could add in the future. I’m always happy to hear feedback.