

Accuracy Distributions of 1000 GM Games
Accuracy Distributions of 1000 GM Games
How is the accuracy related to the rating?

In preparation for analysing the ongoing Norway Chess tournament like I did for the Candidates, I thought that it might be interesting to get some reference data for the accuracy of play.
So I analysed over 1,000 games from super tournaments but also from open tournaments in order to get a large dataset of moves in order to compare the accuracy.
Data
I analysed all classical games from 2023 where both players were over 2700. In order to get an idea of how accurate the top players are playing in relation to other players, I also analysed a couple of open tournaments, like the Sharjah Masters and the 2023 Grand Swiss.
So most of the games are from grandmasters, but there is still a rating disparity between the players and my hope going into this project was that this would show up in the accuracy distribution graphs.
But before we dive in to the graphs, I should explain exactly what they are showing.
Accuracy Distribution
I've written about centipawn loss distributions before, but since I made some slight changes, I think it's a good idea to explain what I'm doing here.
Usually when accuracy is presented, it's an average value for the whole game. But computing the average hides some of the data and it's impossible to see if there were many blunders in the games or if the level was pretty even throughout the game.
So I think that it might be more insightful to look at the distribution of the move accuracies. Instead of computing the average, I count the number of moves with a specific accuracy and plot the resulting distribution.
In order to compute the accuracy, I use the formula that Lichess is using1. Note also that the y-axis is logarithmic and that I show the relative number of moves instead of the total number.
Results
The first thing I did was plotting the accuracy distribution for all 90,000 moves that I analysed with engines.
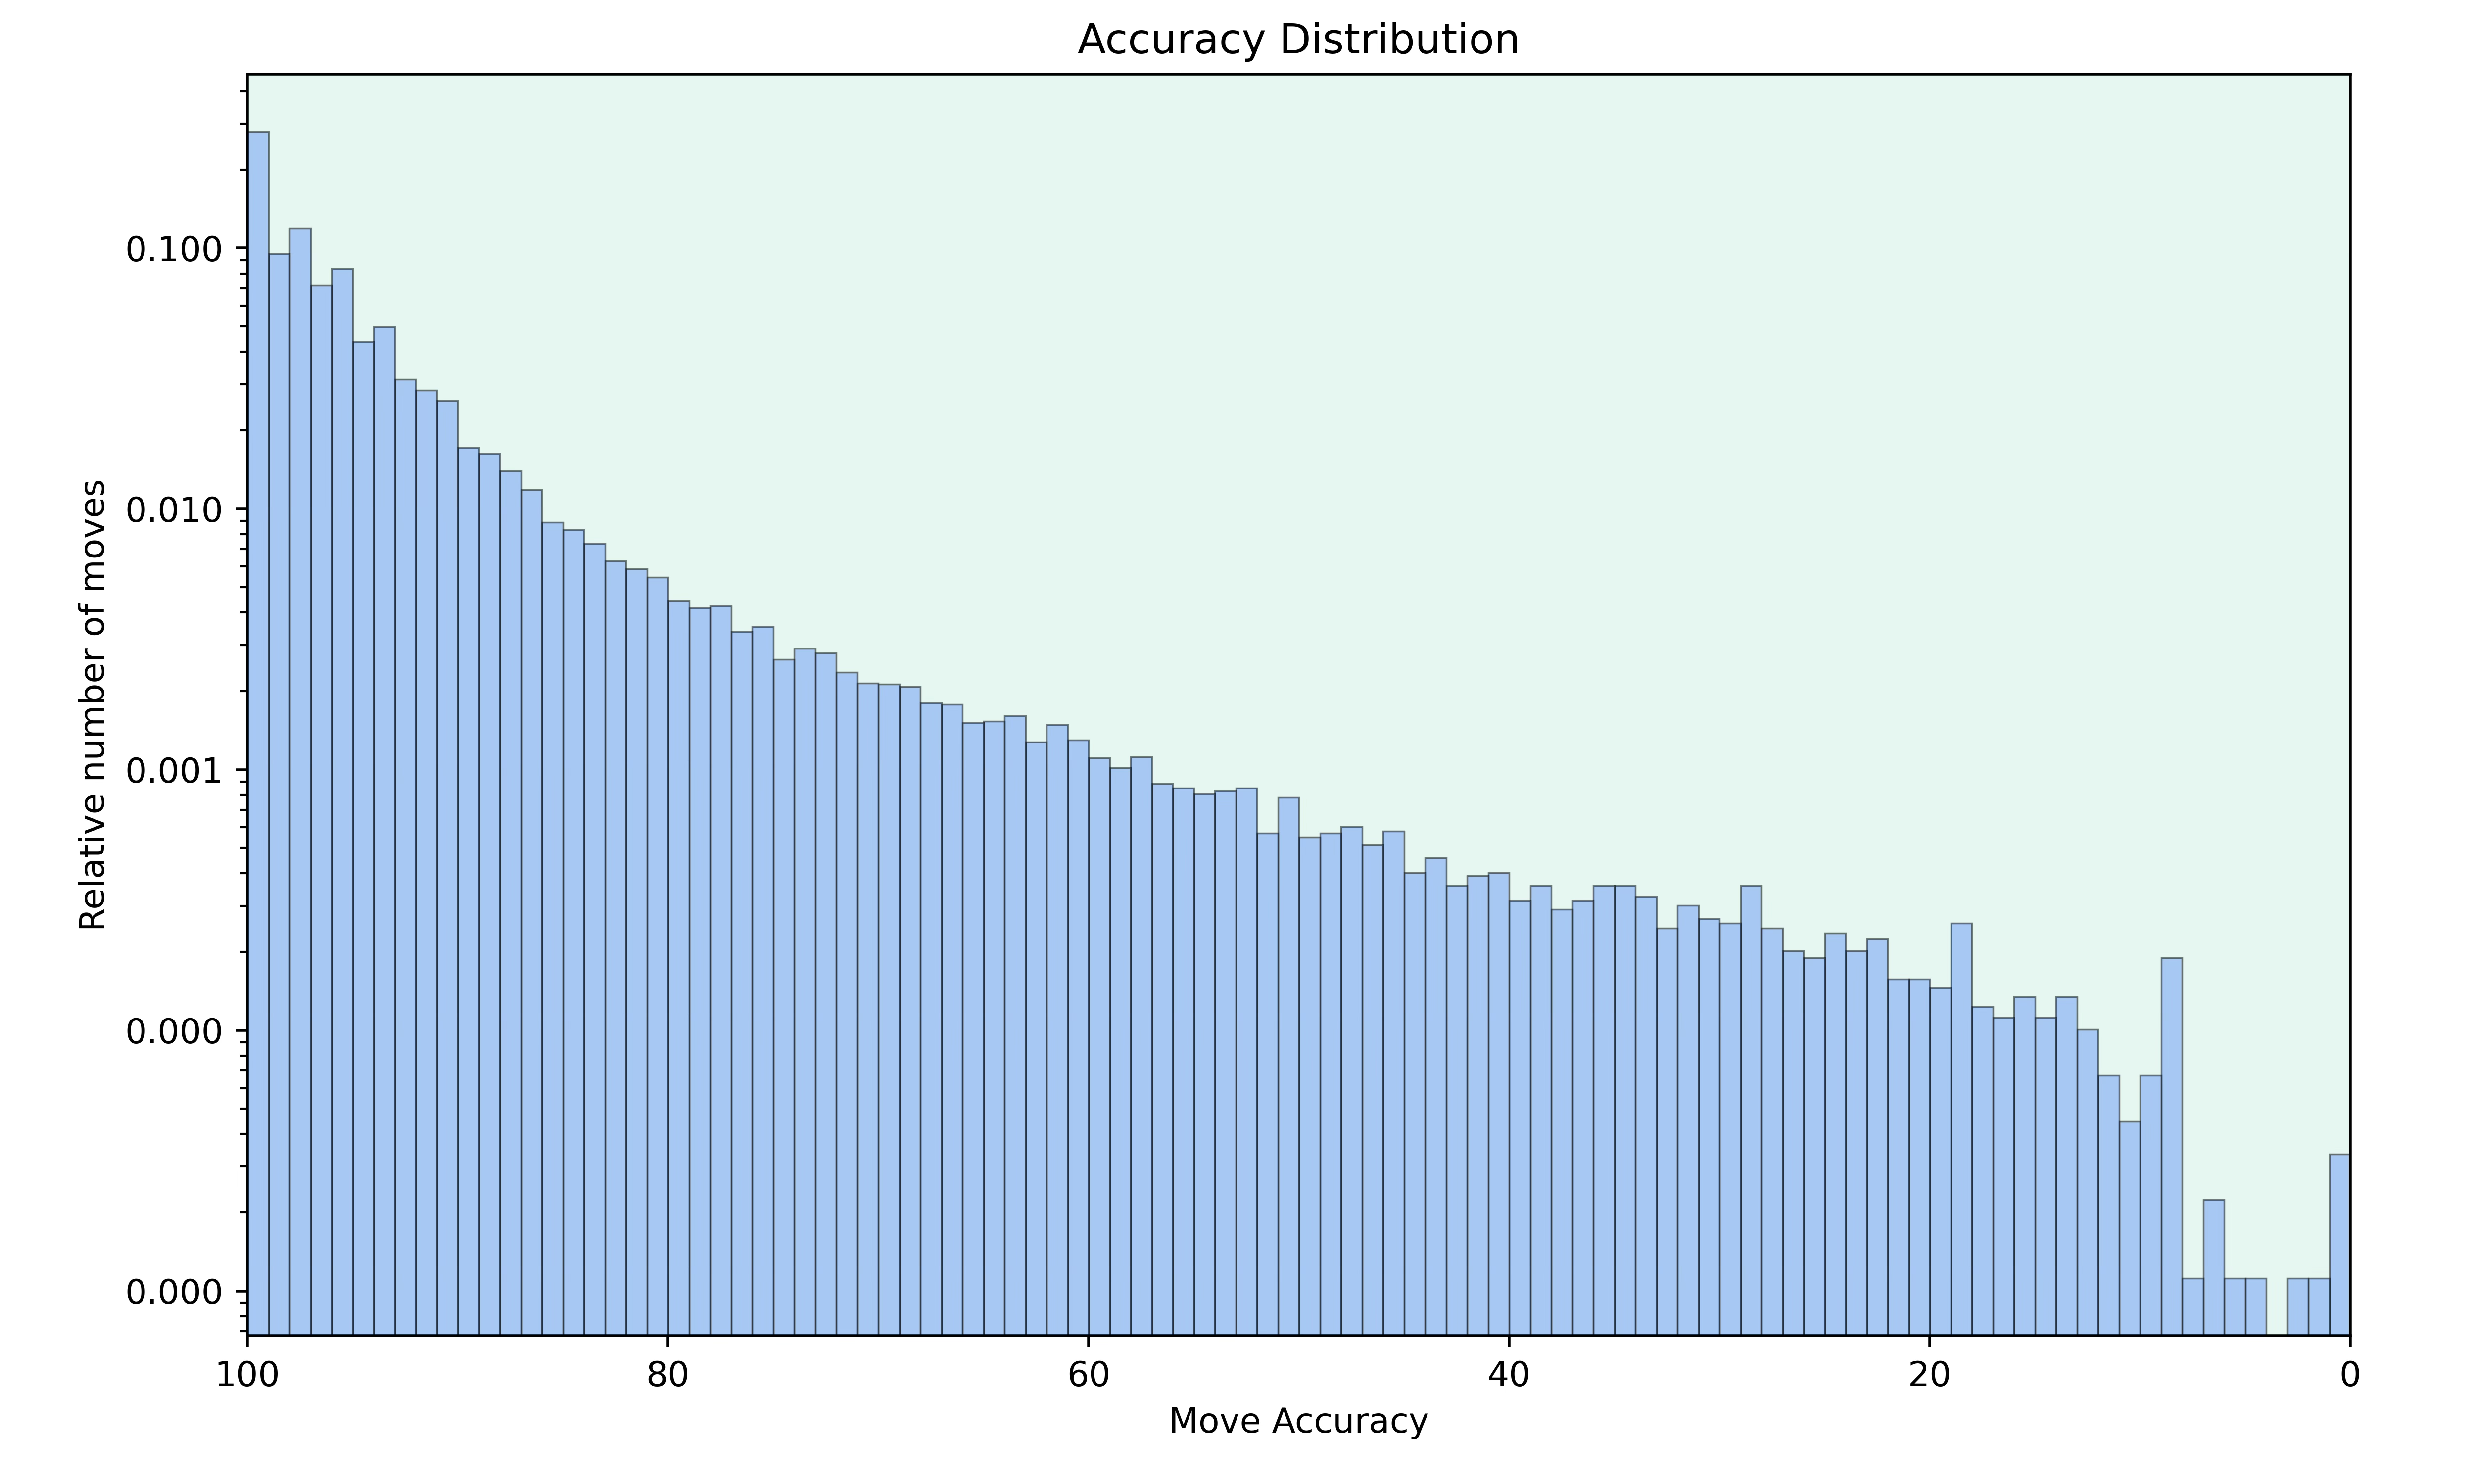
It's great to see how smooth this histogram is. There are hardly any spikes until we get to an accuracy of around 15, which is extremely low and the moves with such an accuracy are huge blunders which rarely happen at that level.
Next I wanted to compare the accuracies of different rating levels. So here are the distributions of players rated below 2600 compared to players rated above 2600.
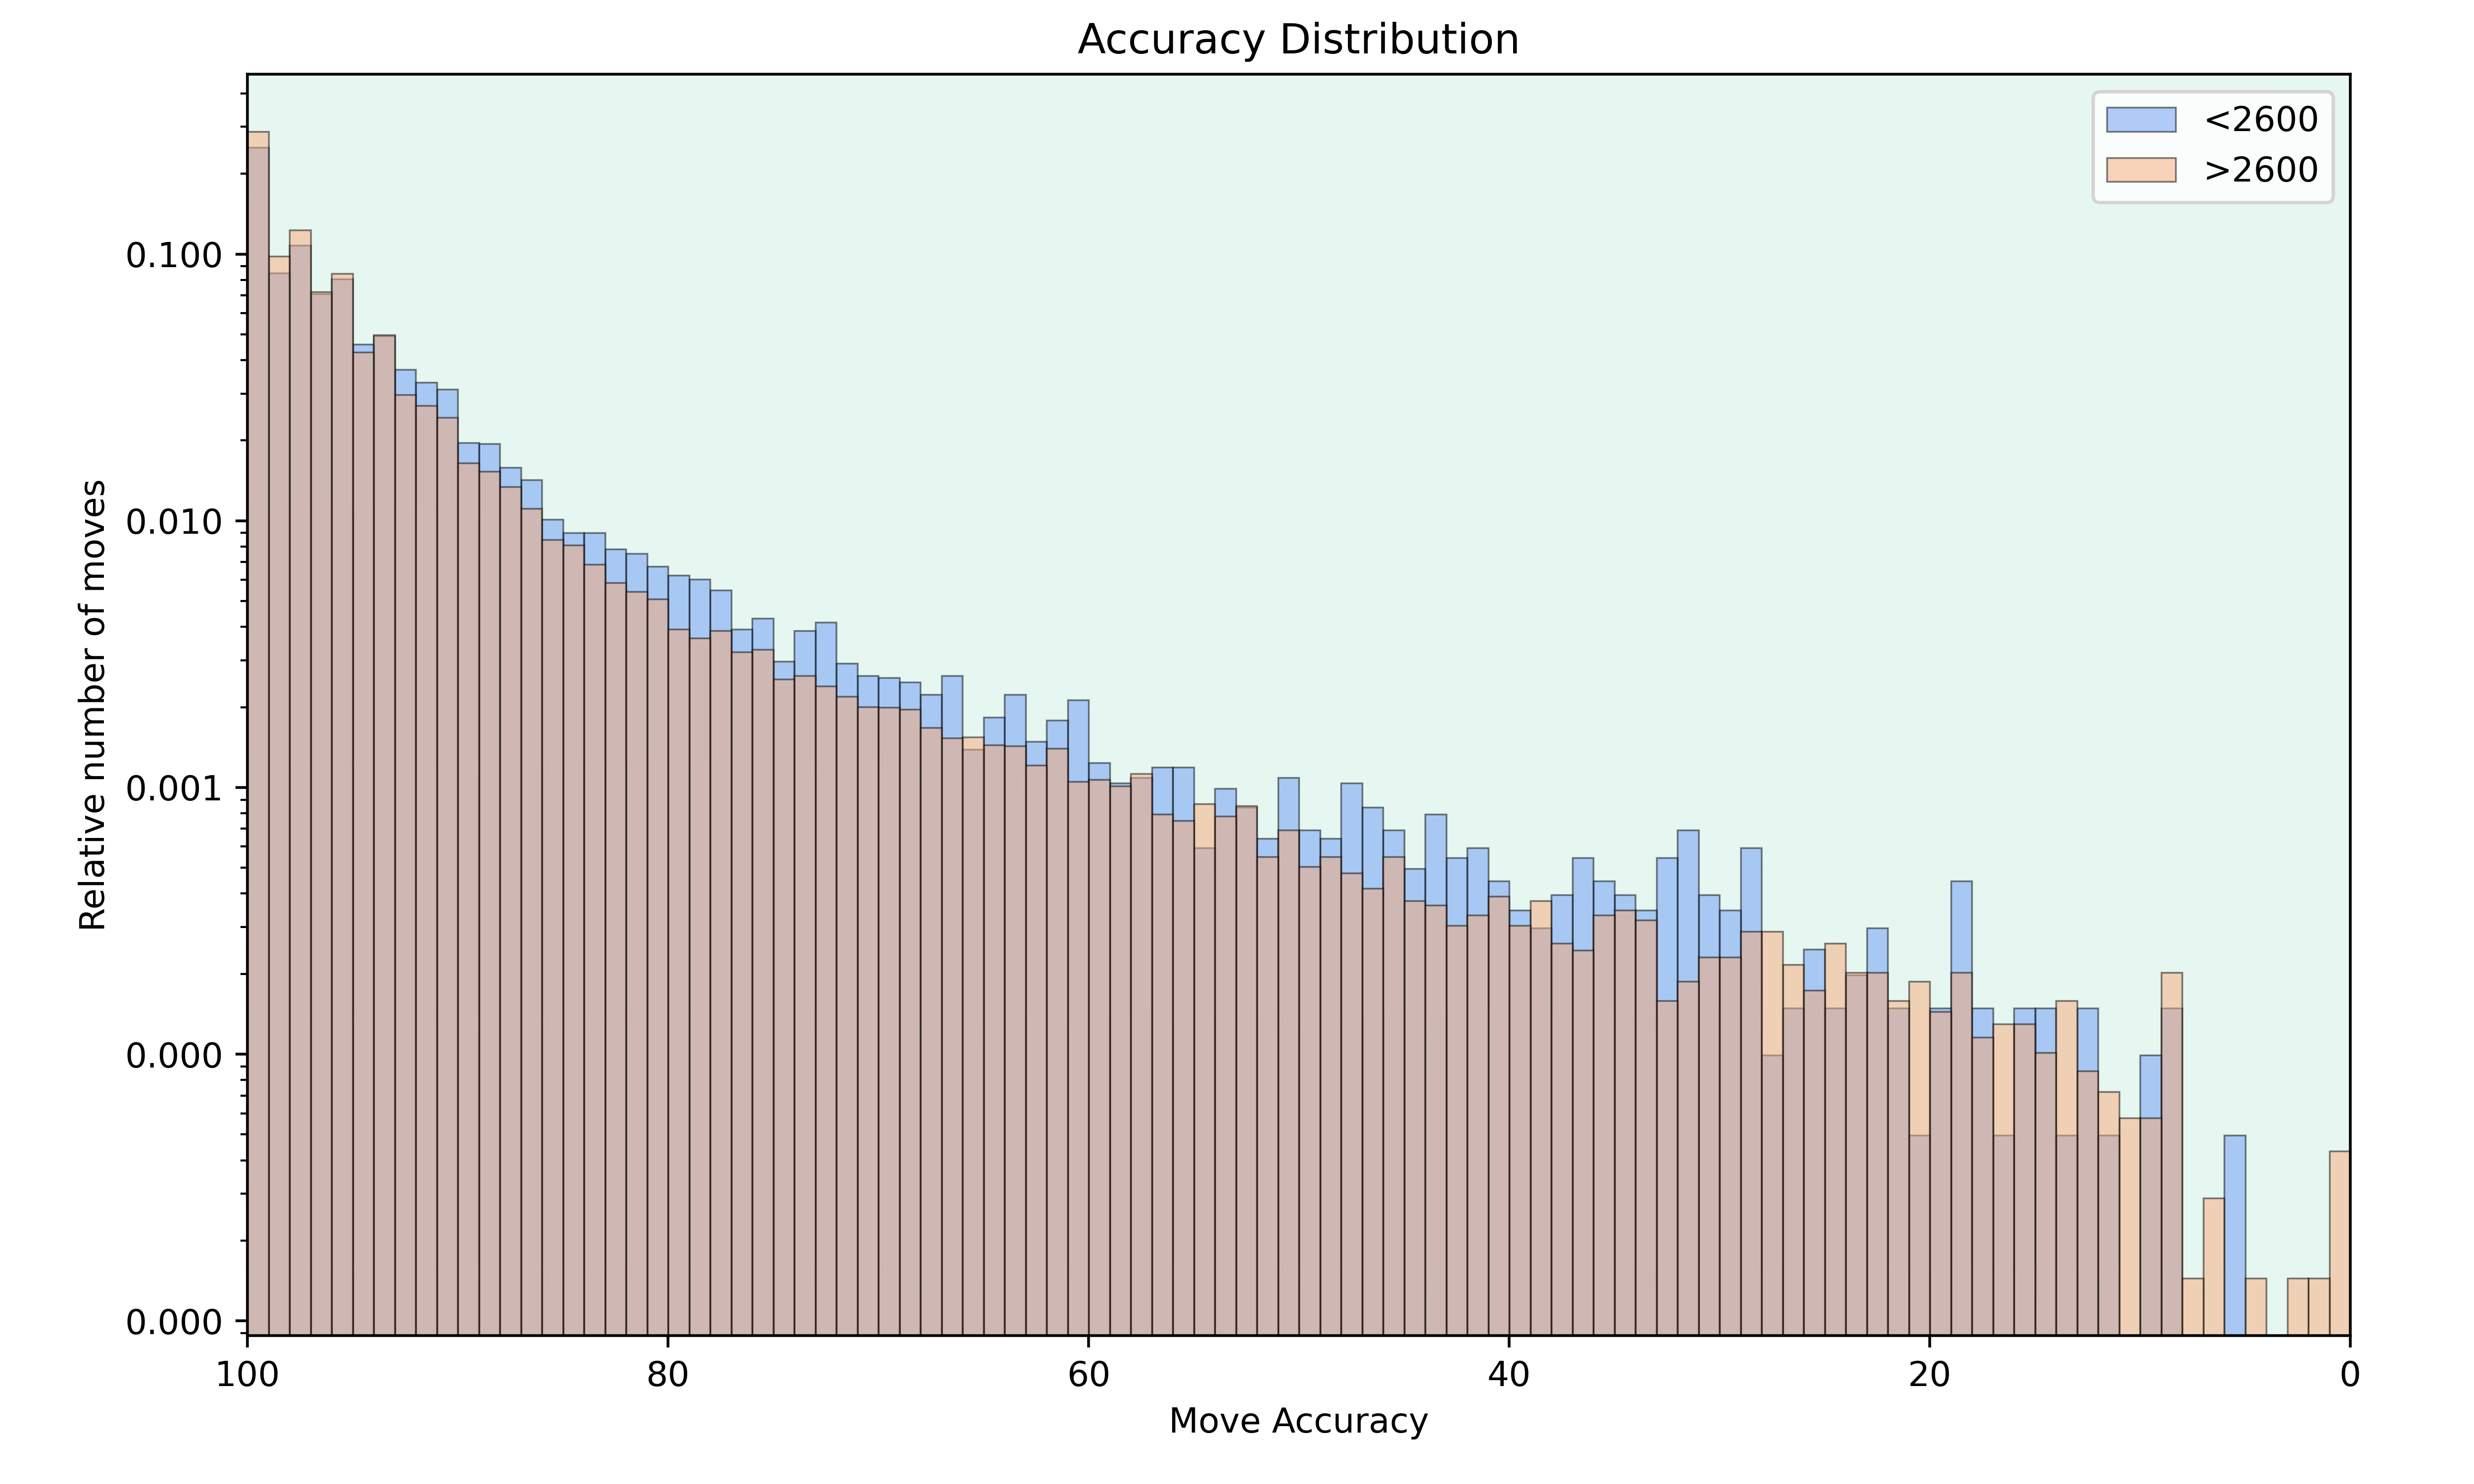
The distributions show that 2600+ players play more very accurate moves2. And players rated below 2600 in turn play more moves with an accuracy somewhere between 30 and 90. This makes the difference in the level of play clear. Again, I wouldn't look at lower accuracies too much since the total number of moves is tiny.
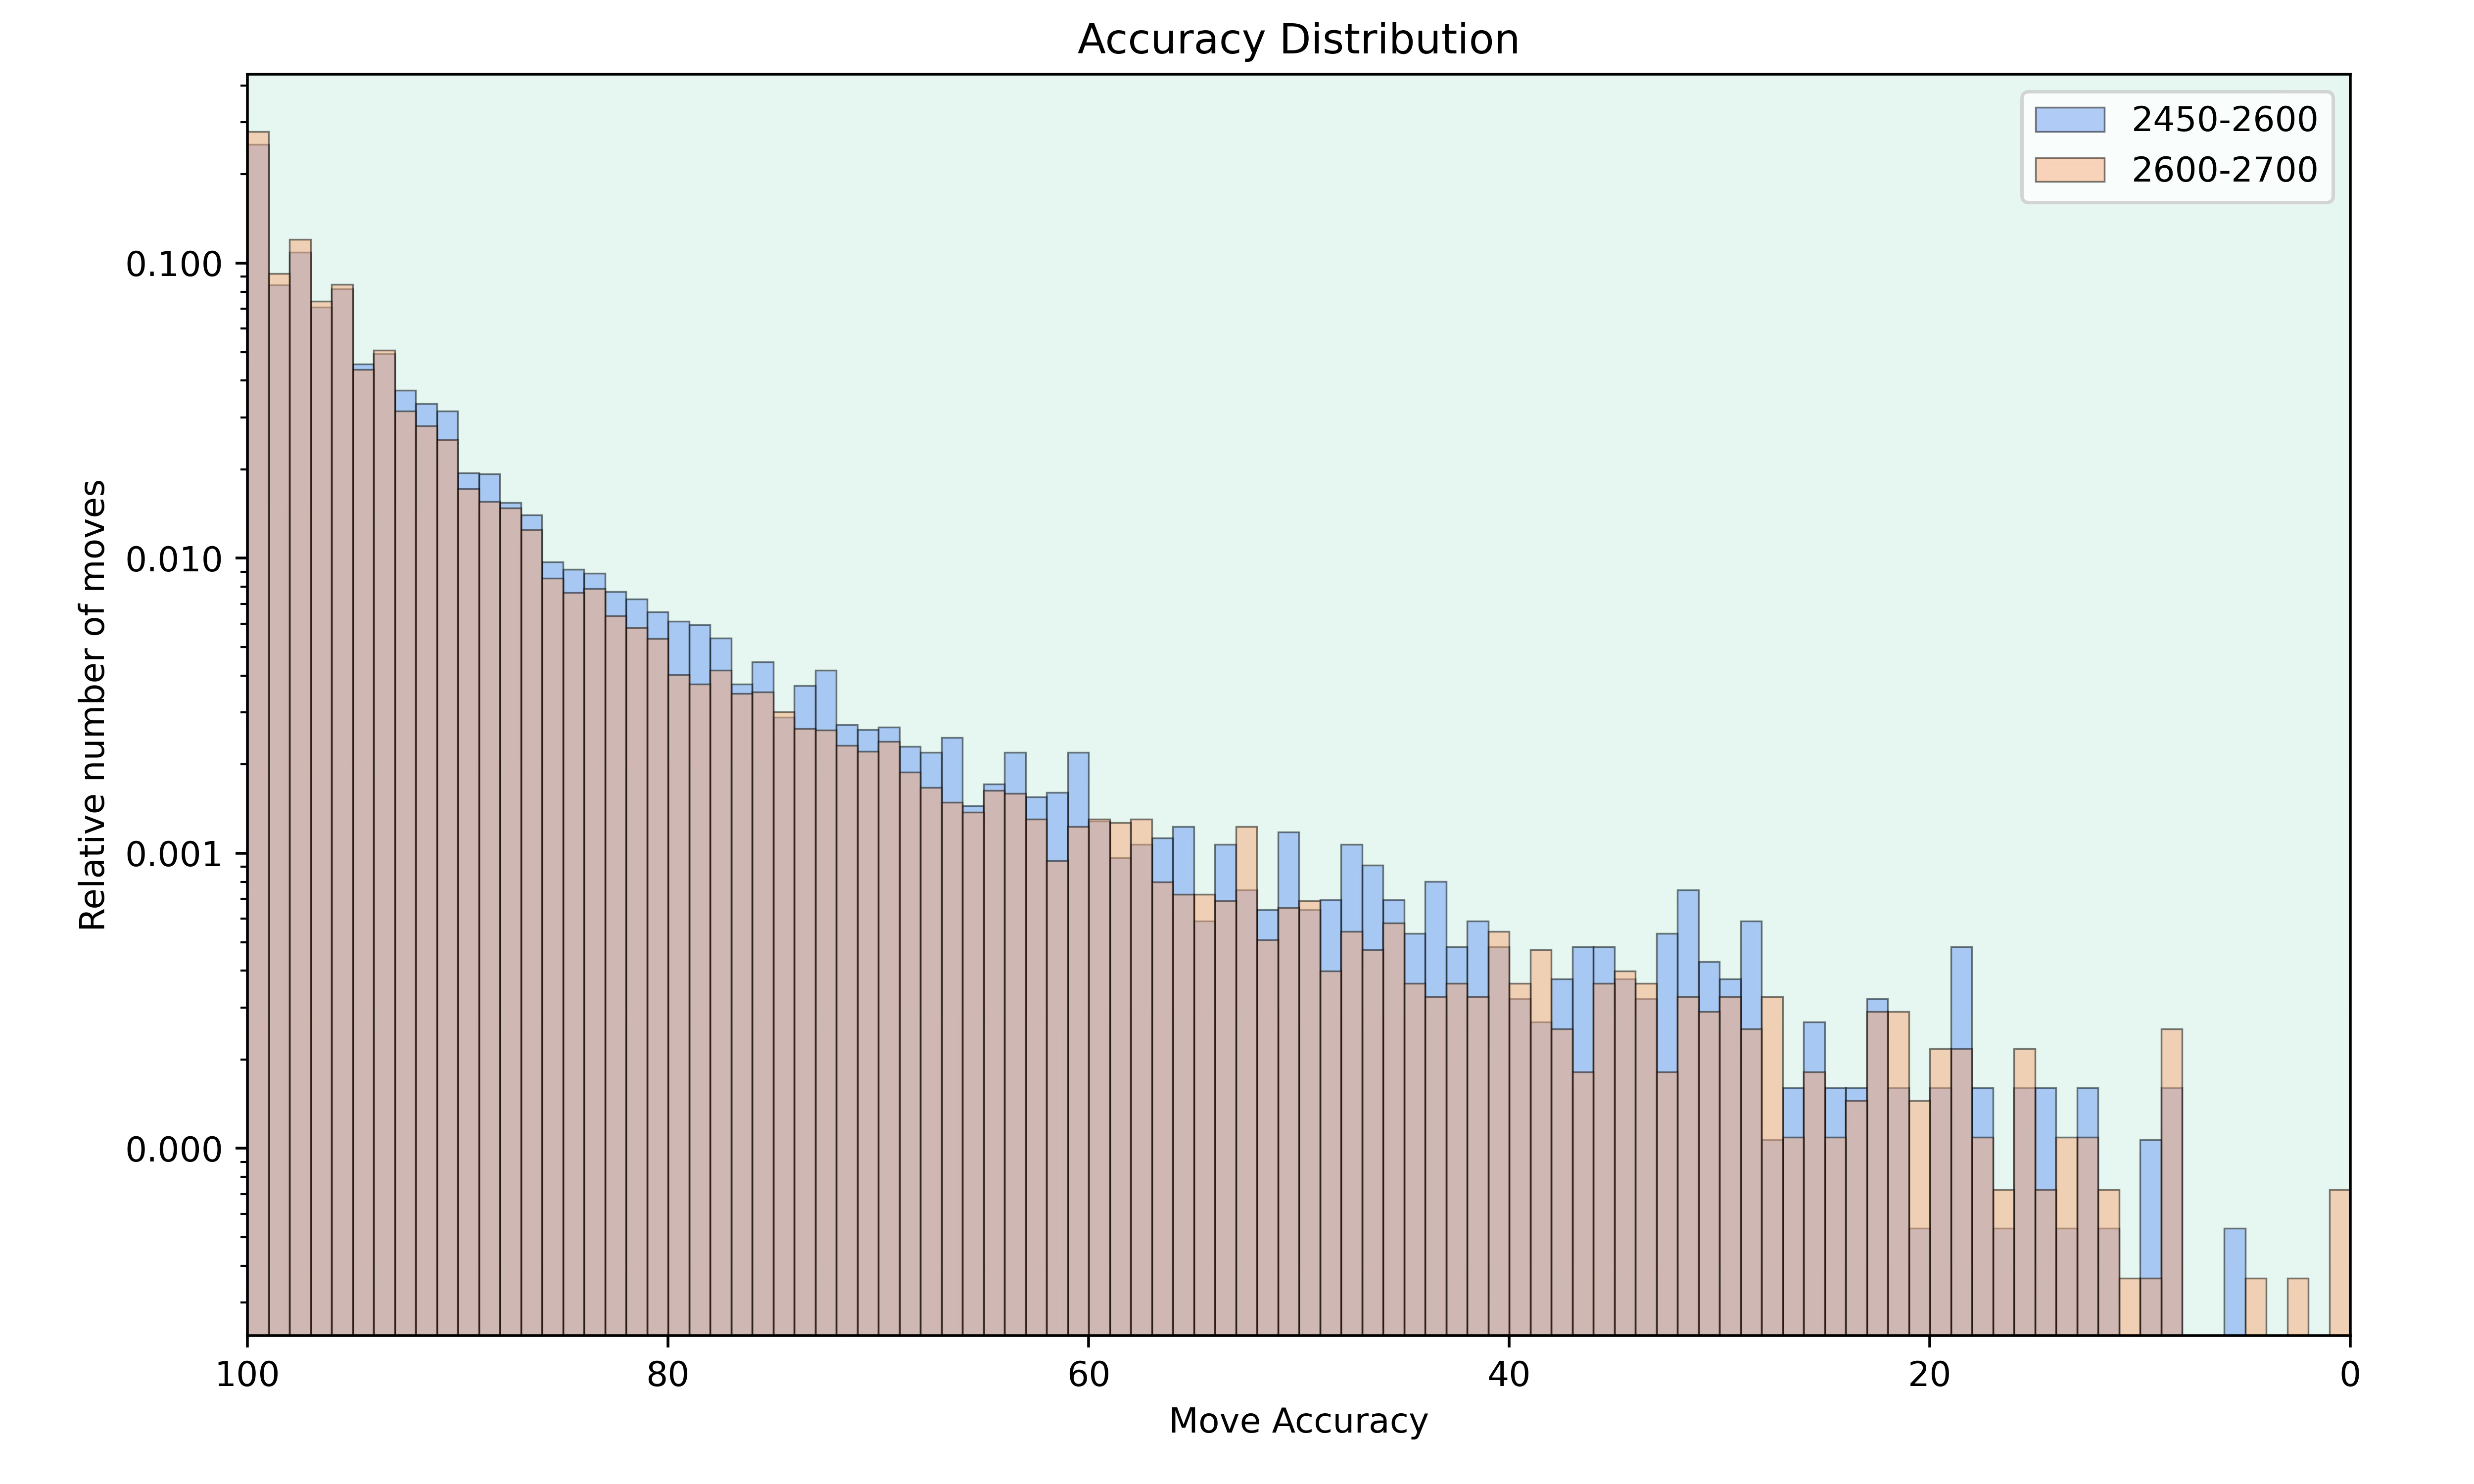
Finally, I decided to look at the differences between narrower rating bands. First I compared the accuracy of players in the 2450 to 2600 range to the accuracy of players in the 2600 to 2700 range.
And now I also compared the 2600 to 2700 players to 2700+ players.
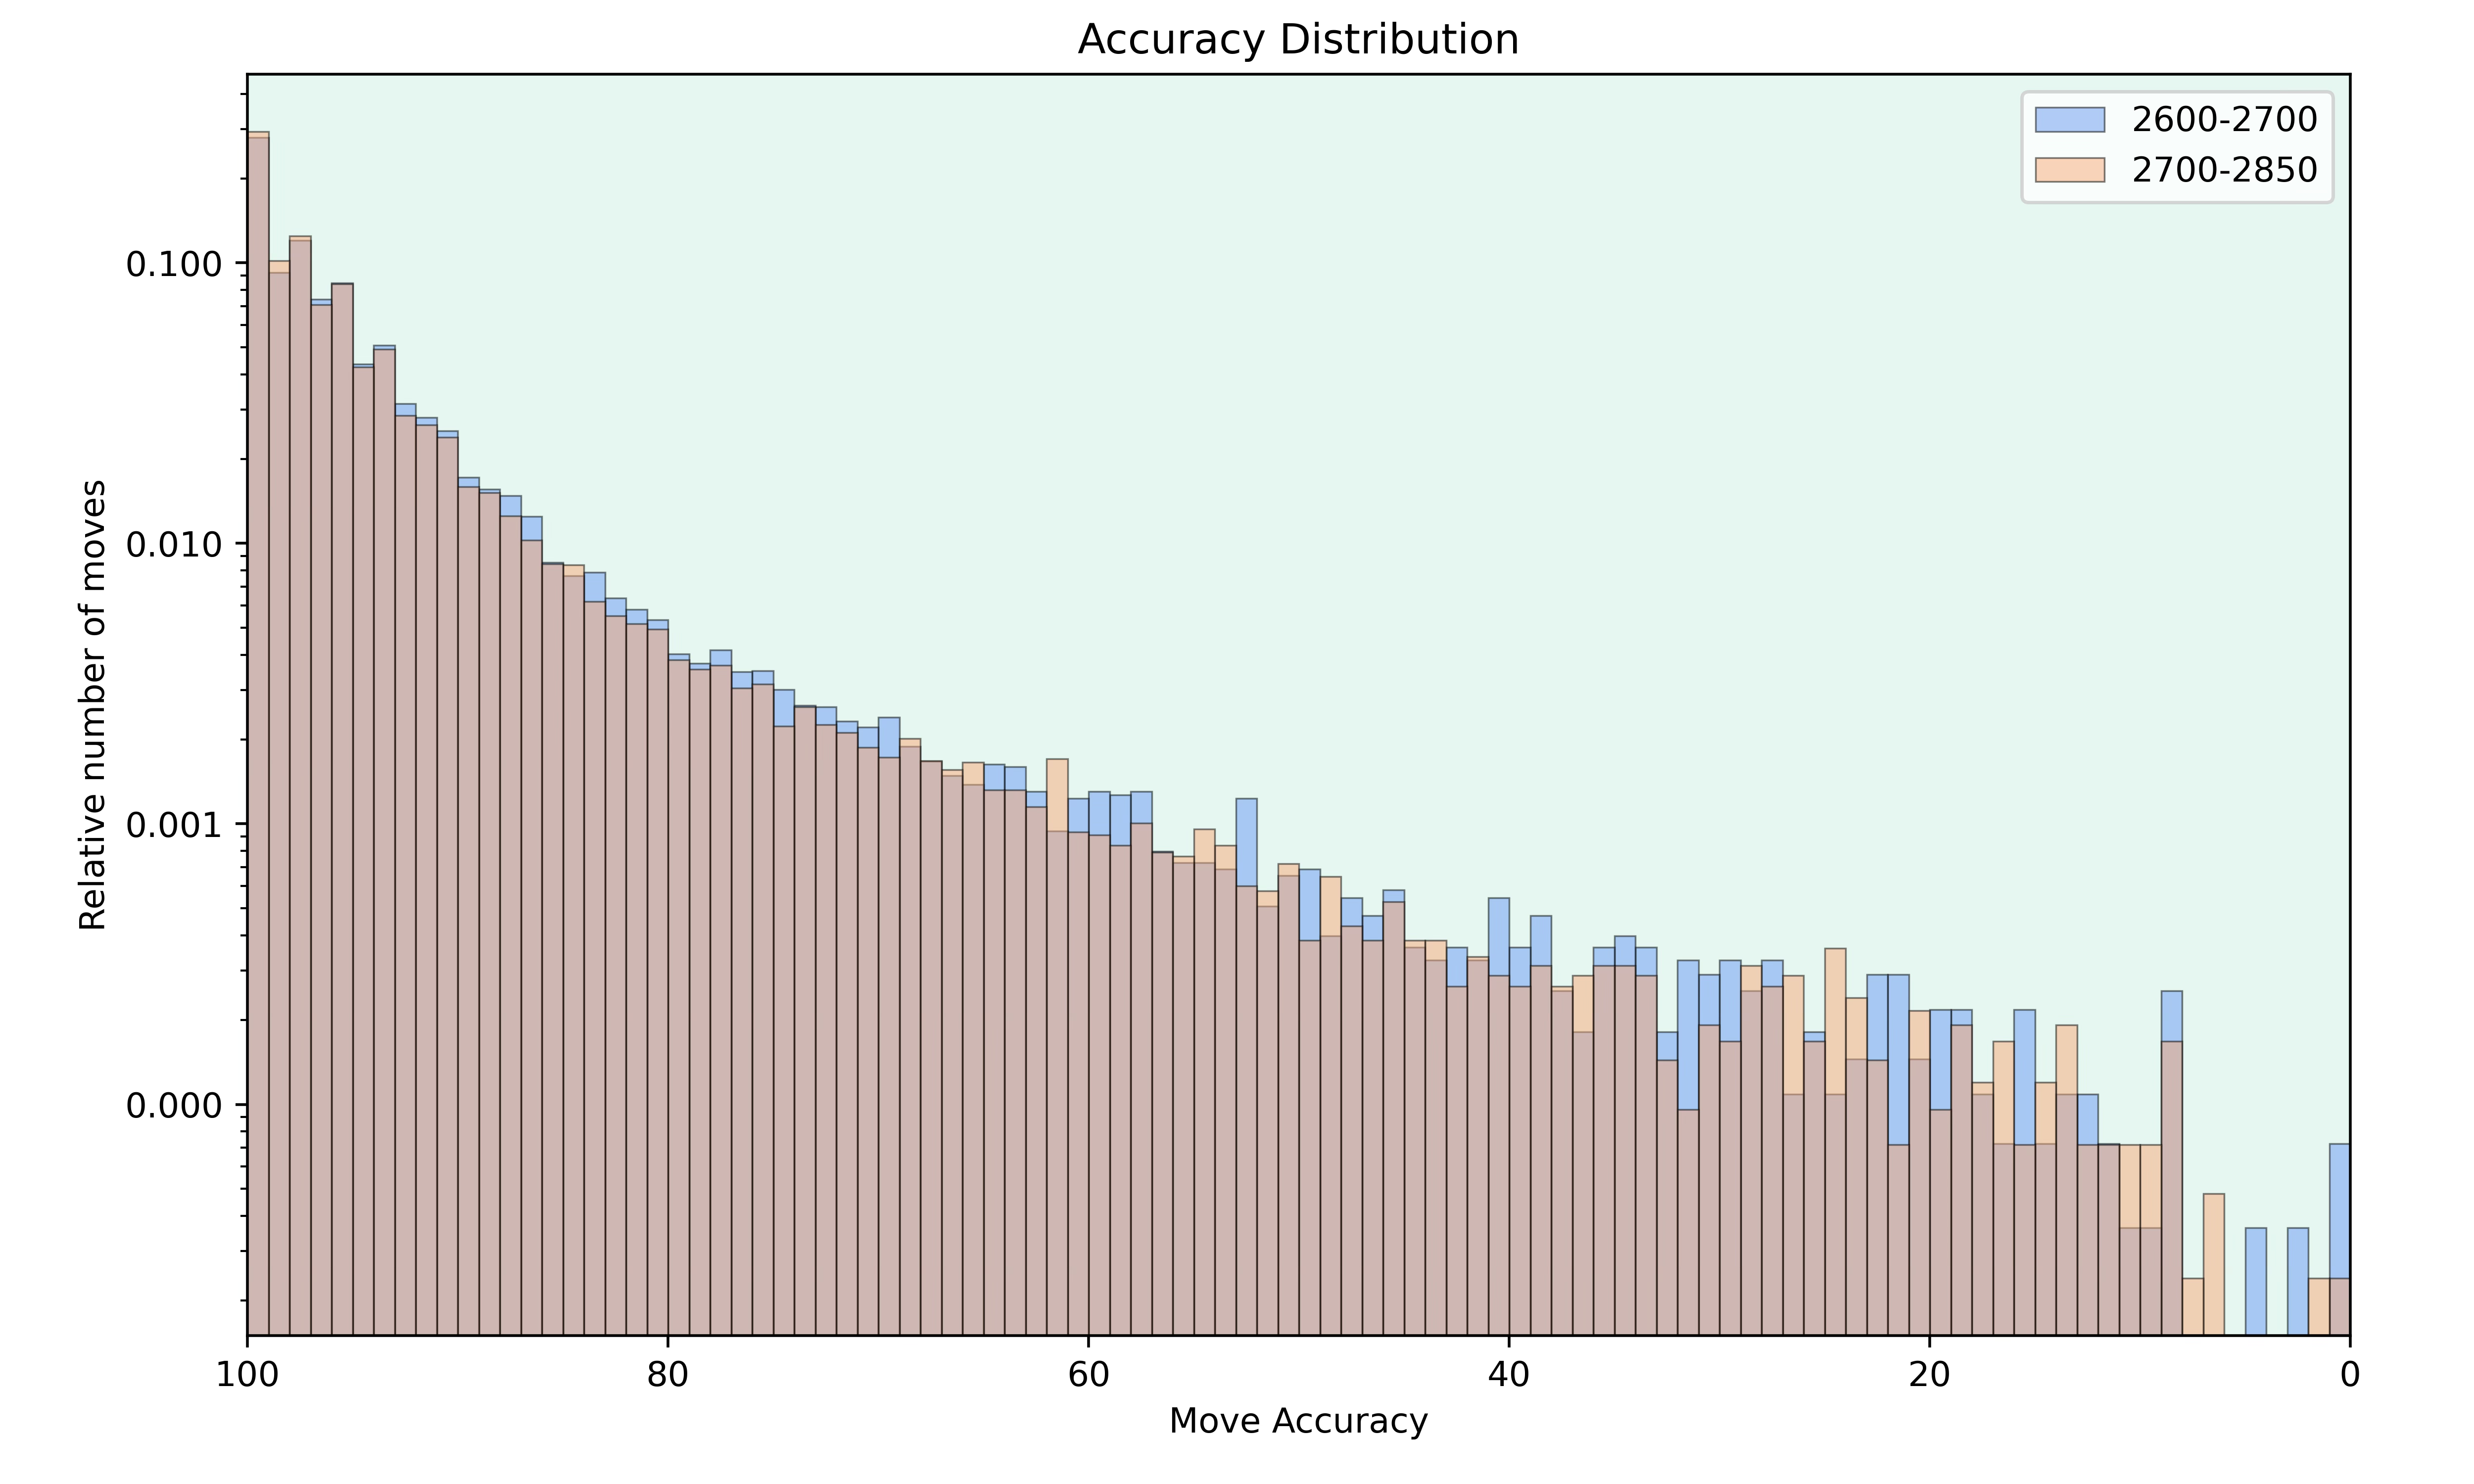
It's clear to see that a higher rating also leads to a higher accuracy, even in quite narrow rating bands. But the graphs are a bit more spiky since there are fewer games in the smaller rating bands compared to the earlier graphs.
Conclusion
I'm really amazed how clear the difference between the accuracies is. I thought that it might be less clear since in every single game, there can be a lot of randomness involved. But having enough games seems to average these factors out.
I think that this analysis gives a nice basis for future comparisons of the accuracy of specific players compared to the average accuracy distribution of a given rating range.
Let me know what you think about it.
Note that this formula is optimised for the 2300 level, so the accuracies tend to be quite high for grandmasters.
The differences for the high accuracies look tiny, but due to the log axis, they are greater than they appear on first sight.