The 2024 Candidates in 13 Graphs
Looking at stats from the 2024 Candidates tournament
Recently I’ve written about various ways to use chess engines in order to get an overview of a game or individual players. Now that the Candidates tournament is over, I thought that it might be interesting to look at this tournament. I certainly wasn’t disappointed.
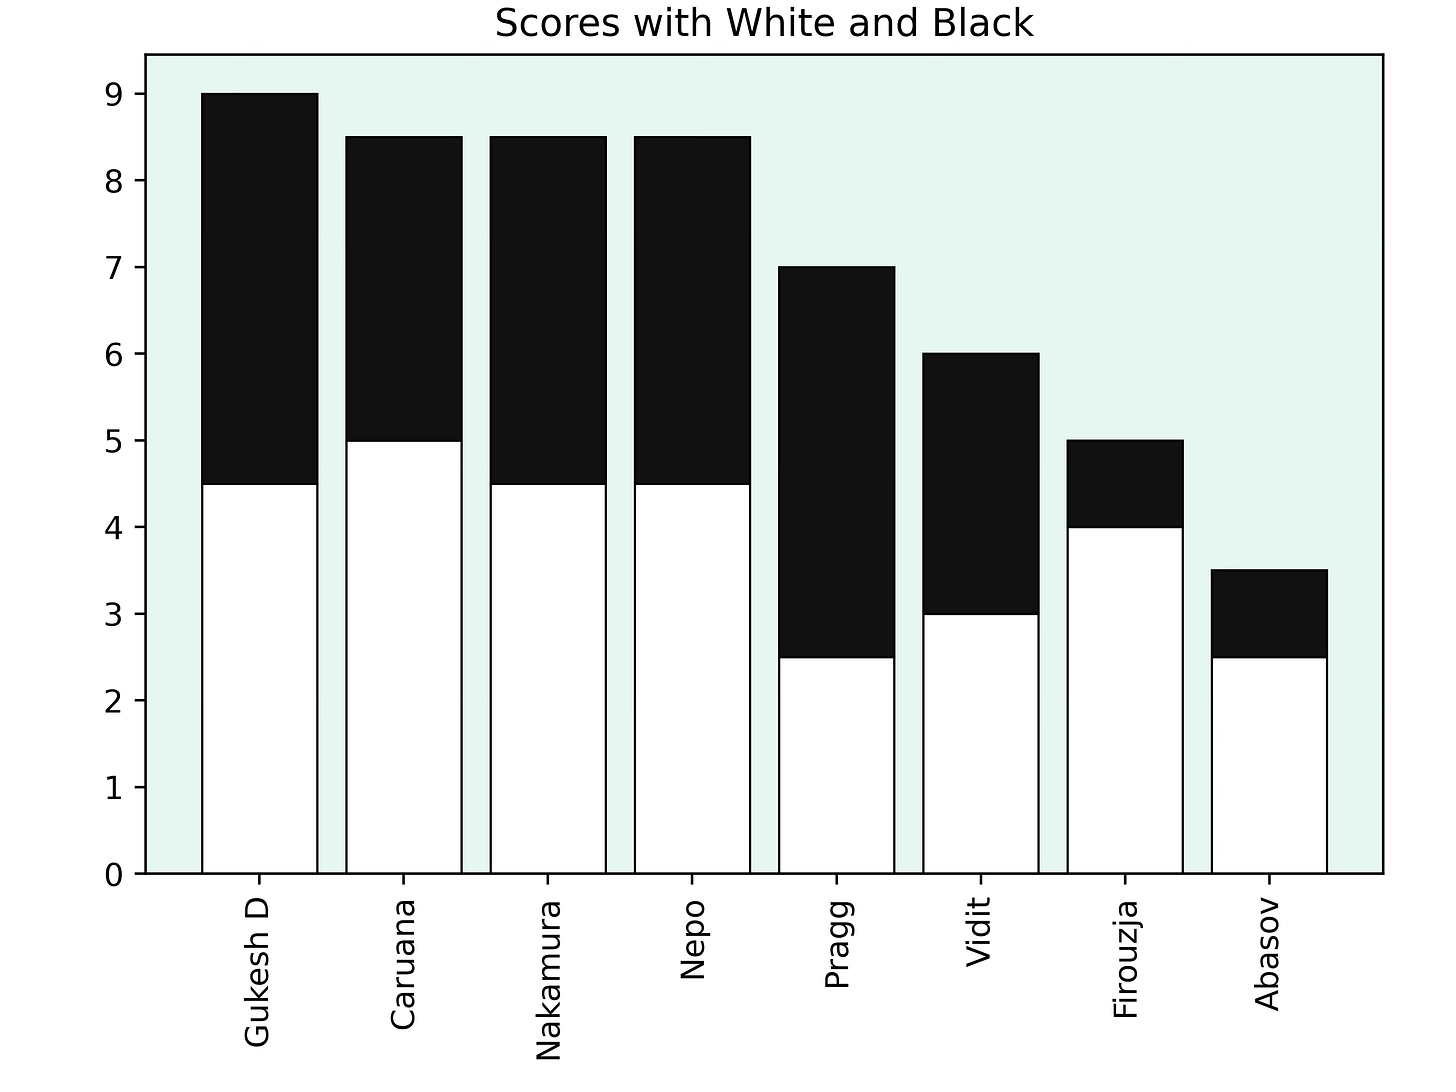
The first thing I took a look at was the scores of the players with White and Black.
It’s interesting to see that Pragganandhaa scored very well with Black and that Firouzja did horribly with Black.
Worse Positions
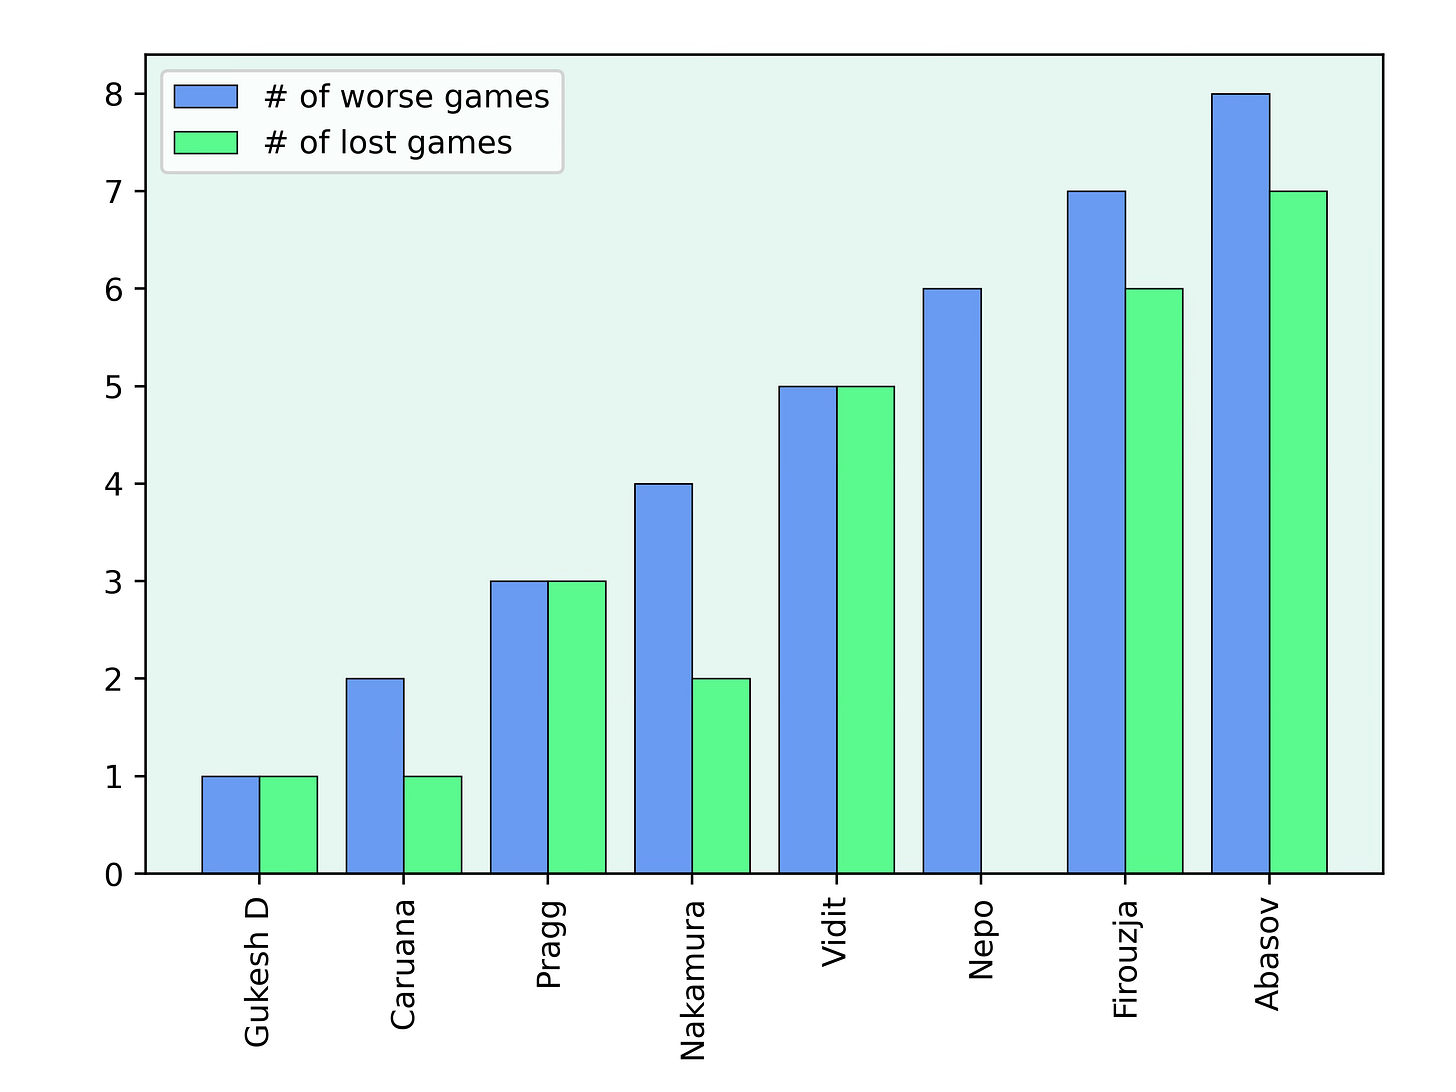
One thing that often makes or breaks a tournament is holding worse positions. Therefore I looked at the number of games where each player was significantly worse (more than a -1 disadvantage) and compared it to the number of games they’ve lost.
It’s amazing that Gukesh was only clearly worse in one game (his loss against Firouzja). This shows how well he played. It’s also impressive that Nepomniachtchi was clearly worse in 6 games, but hasn’t lost any of them.
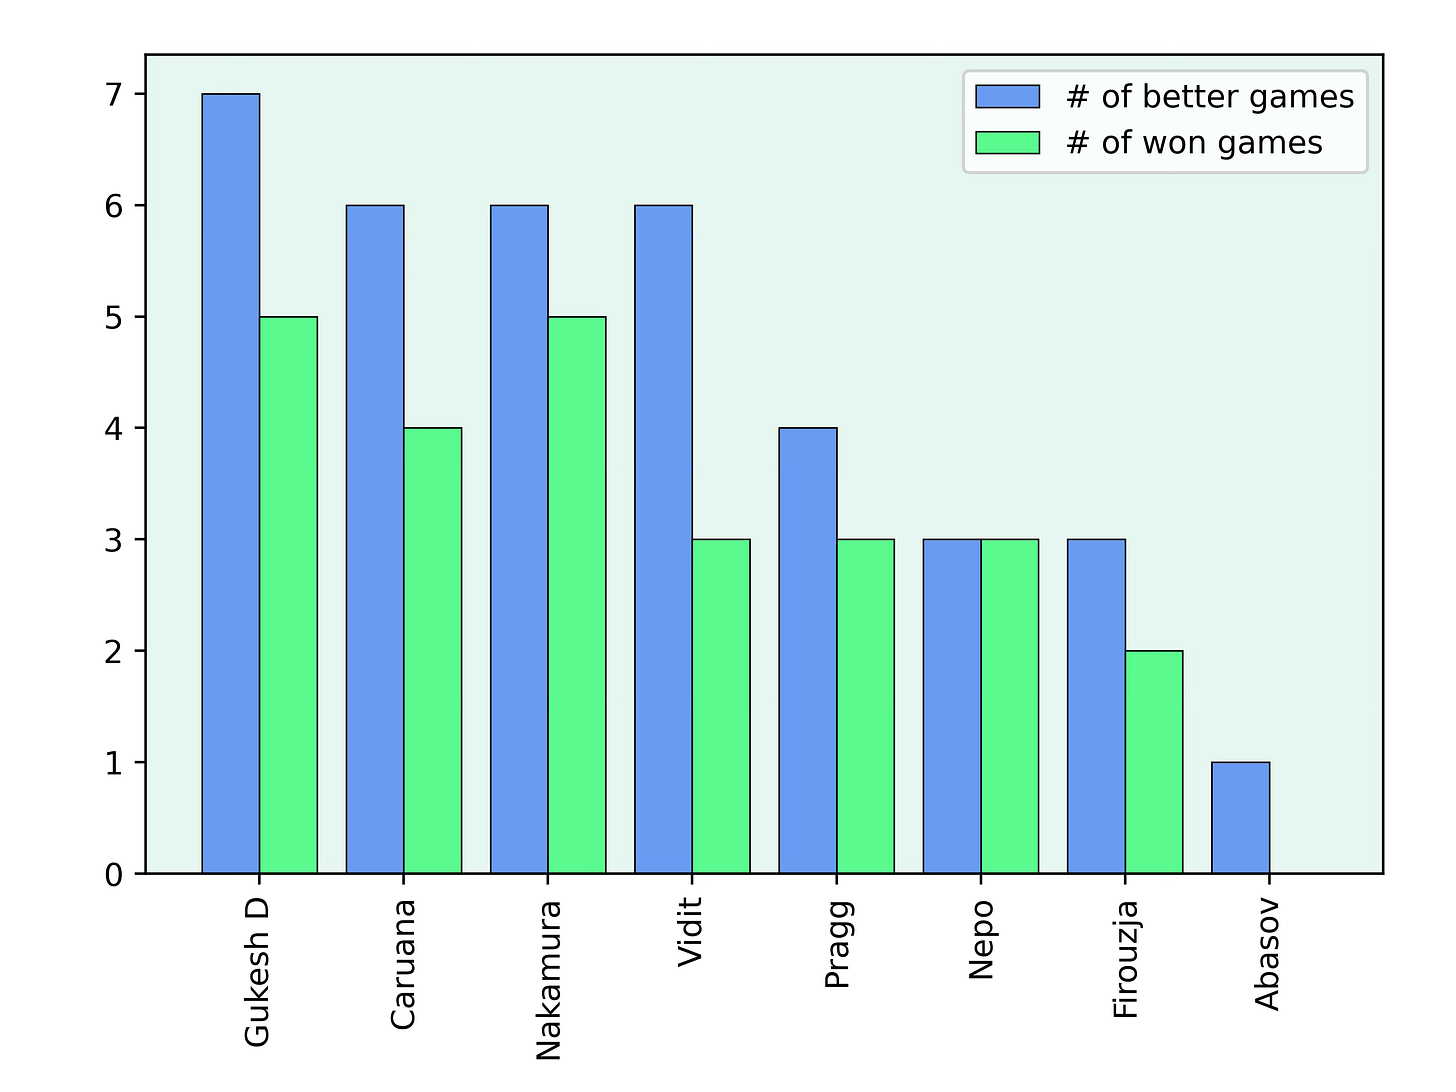
Edit: I also created a plot showing the better positions and won games.
This plot shows that Caruana didn’t use his chances as effectively as others. Again, it’s amazing how well Nepo utilised all his chances.
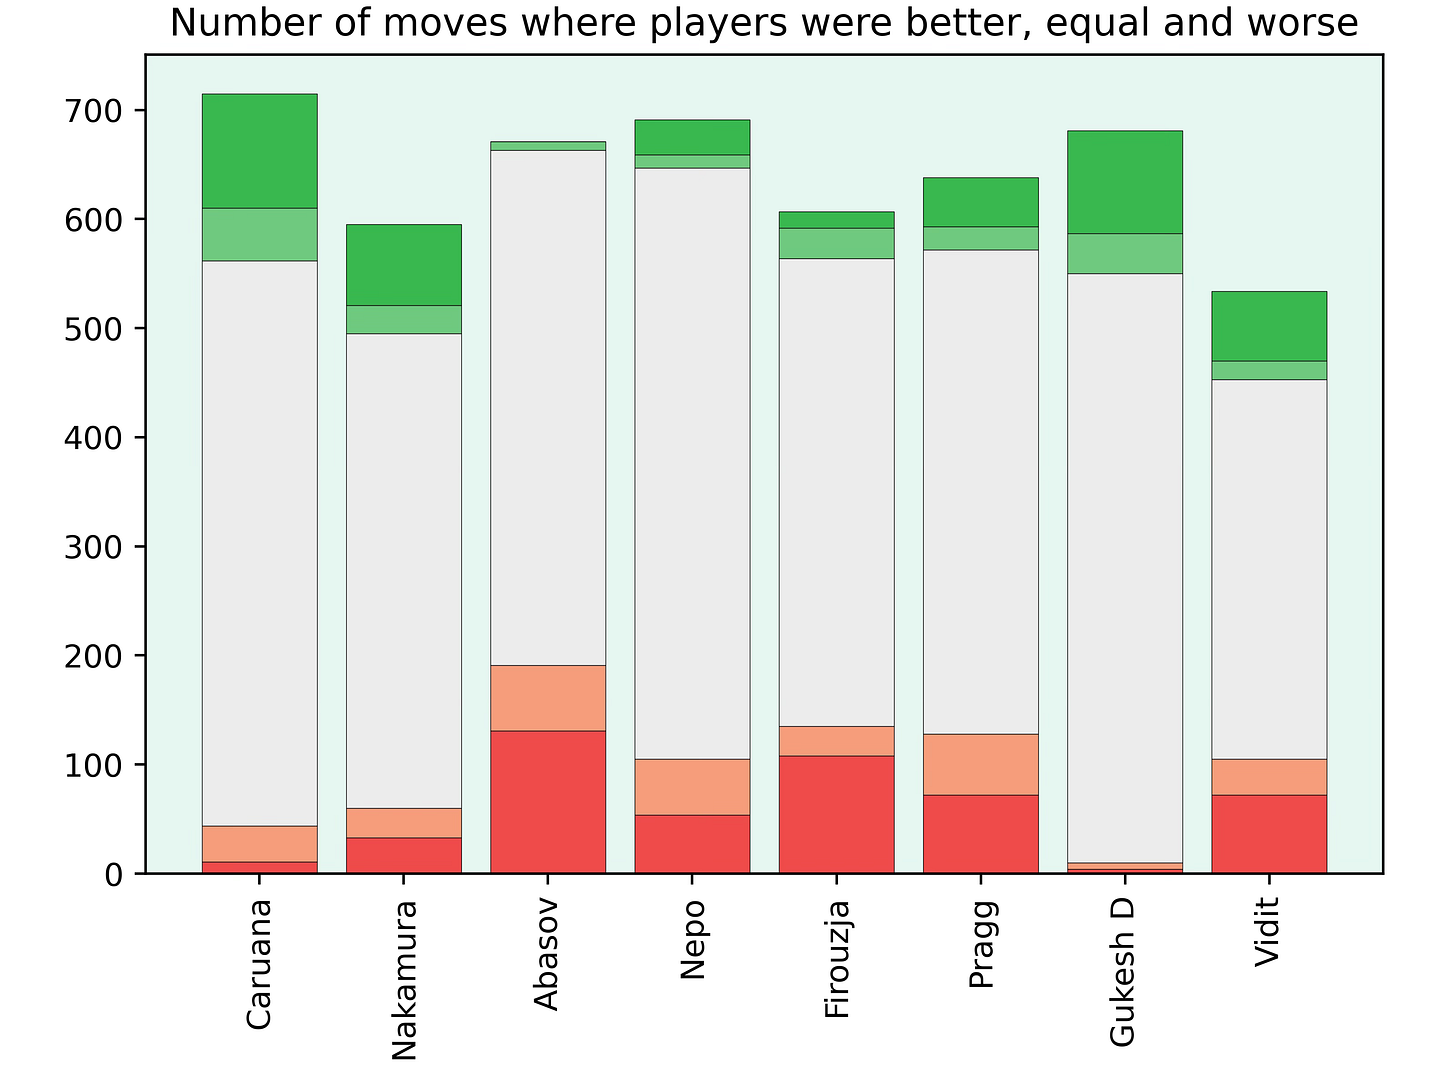
I also decided to look at the number of moves where each player was better or worse. I split it into much worse (<-1), slightly worse (from -1 to -0.5), equal (from -0.5 to 0.5), slightly better (from 0.5 to 1) and much better (>+1).
Again, it’s amazing that Gukesh was hardly ever worse in the whole tournament.
Sharpness
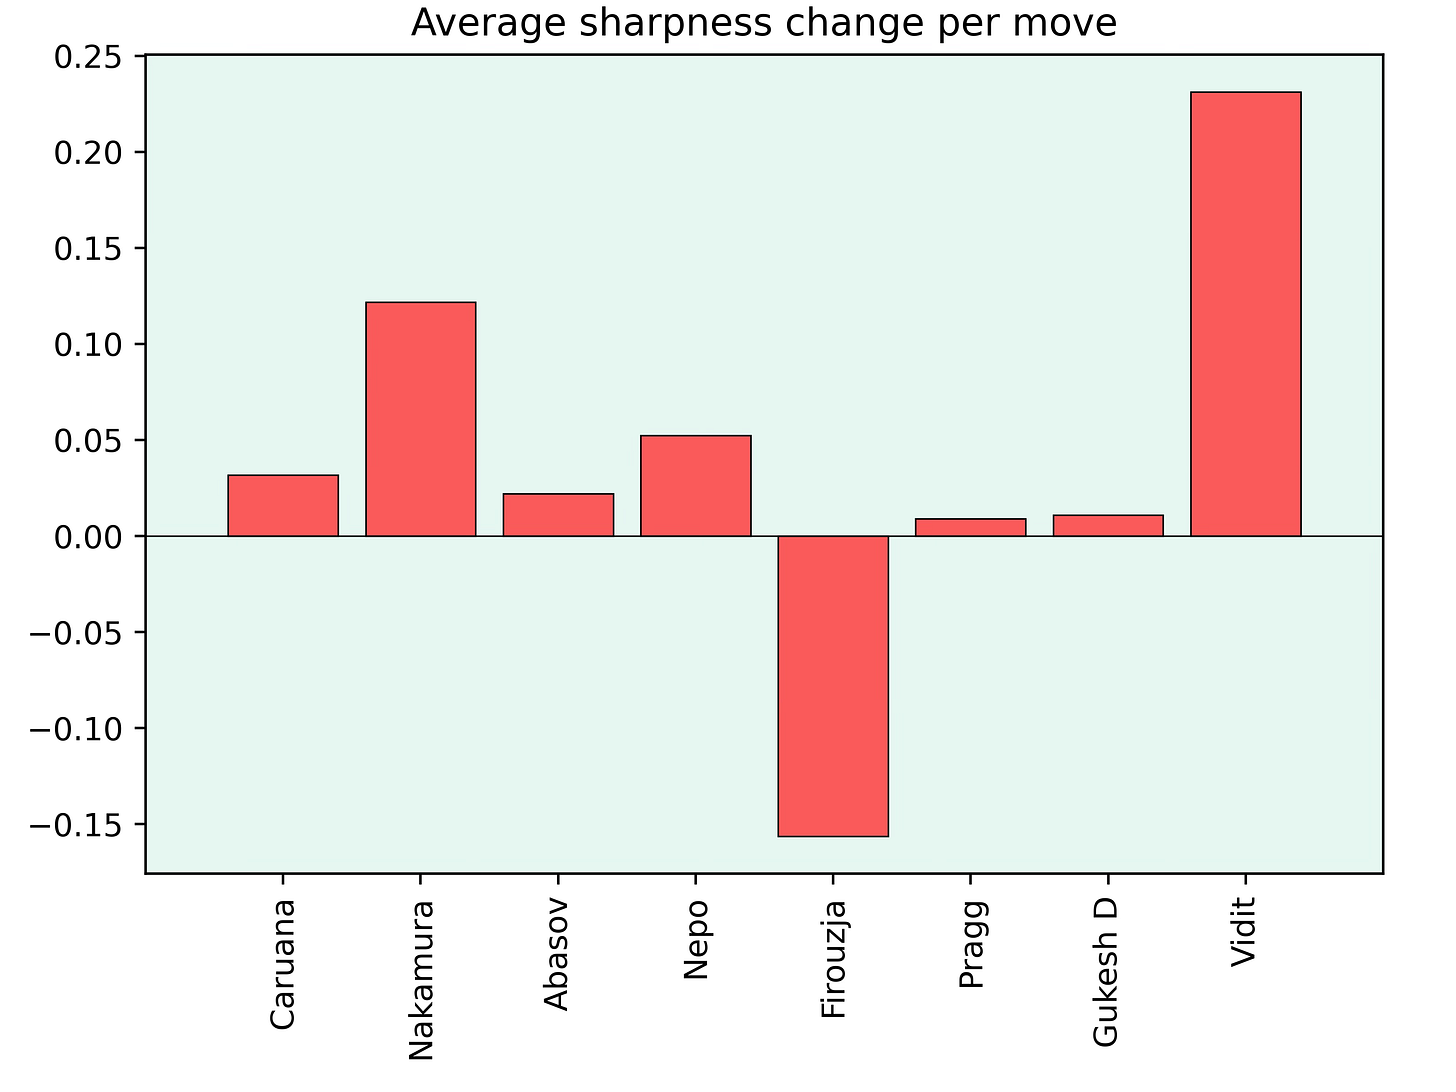
I also generated a plot for the average sharpness change of each player per move. I’ve written about these plots here.
This plot is a bit surprising to me. I thought that Pragg’s sharpness change would be much higher, but maybe I’m too much influenced by his opening choices.
Also Vidit’s and Firouzja’s sharpness changes seem quite extreme. This might be influenced by the quality of their play, which I’ve mentioned in my post on the average sharpness change.
Accuracy Distribution
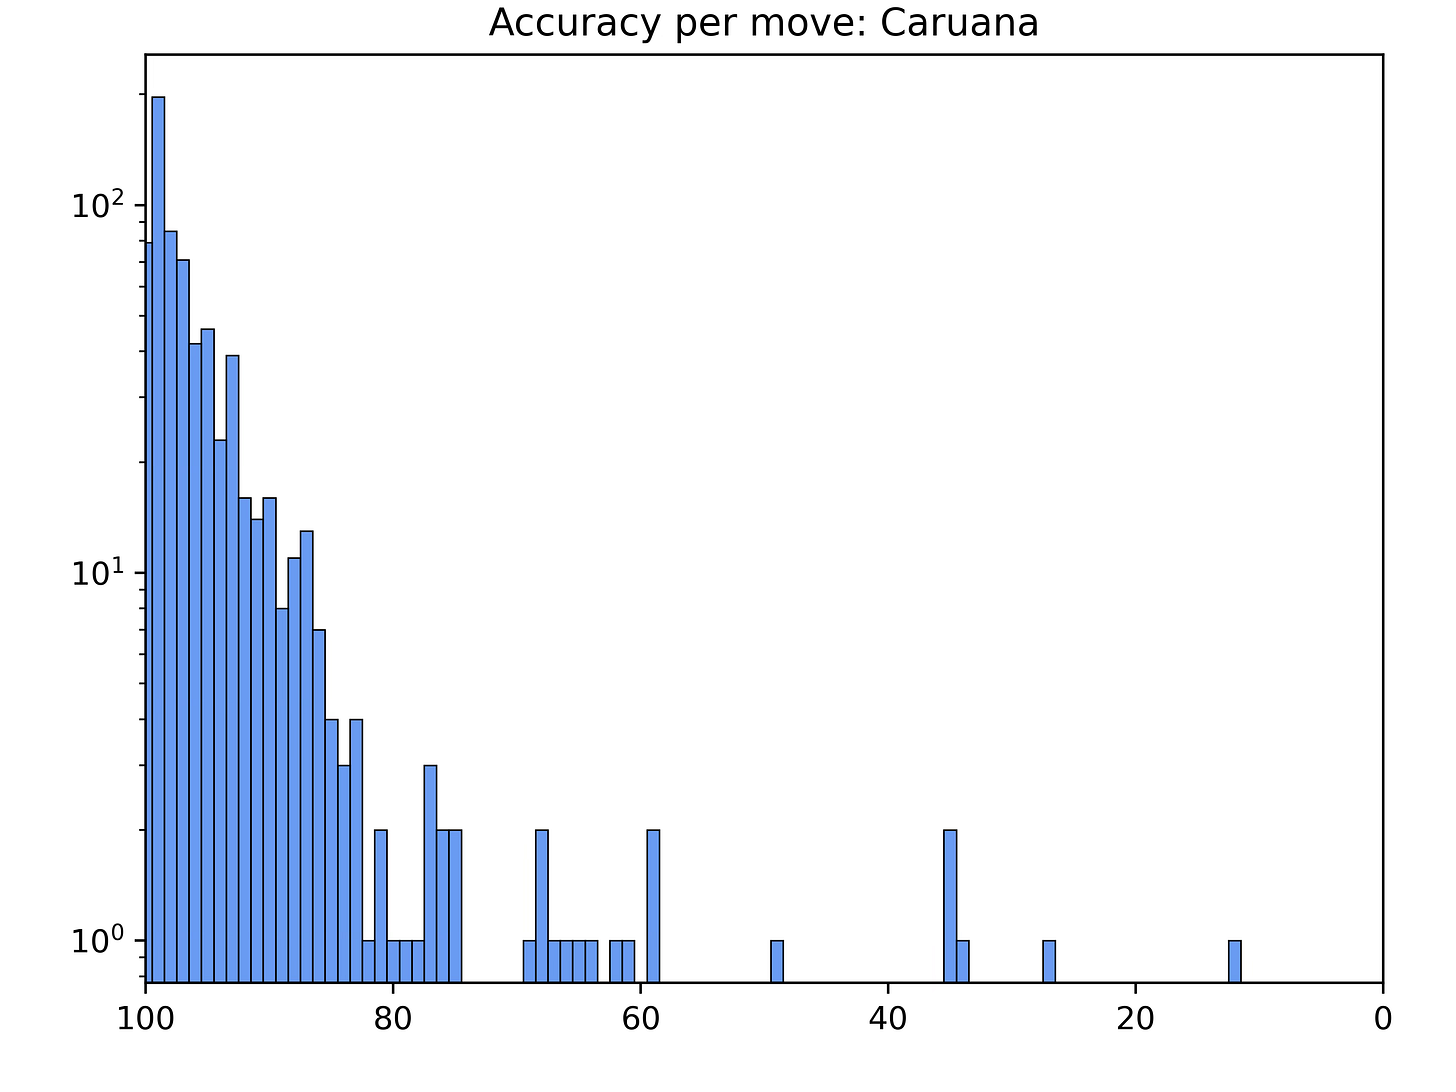
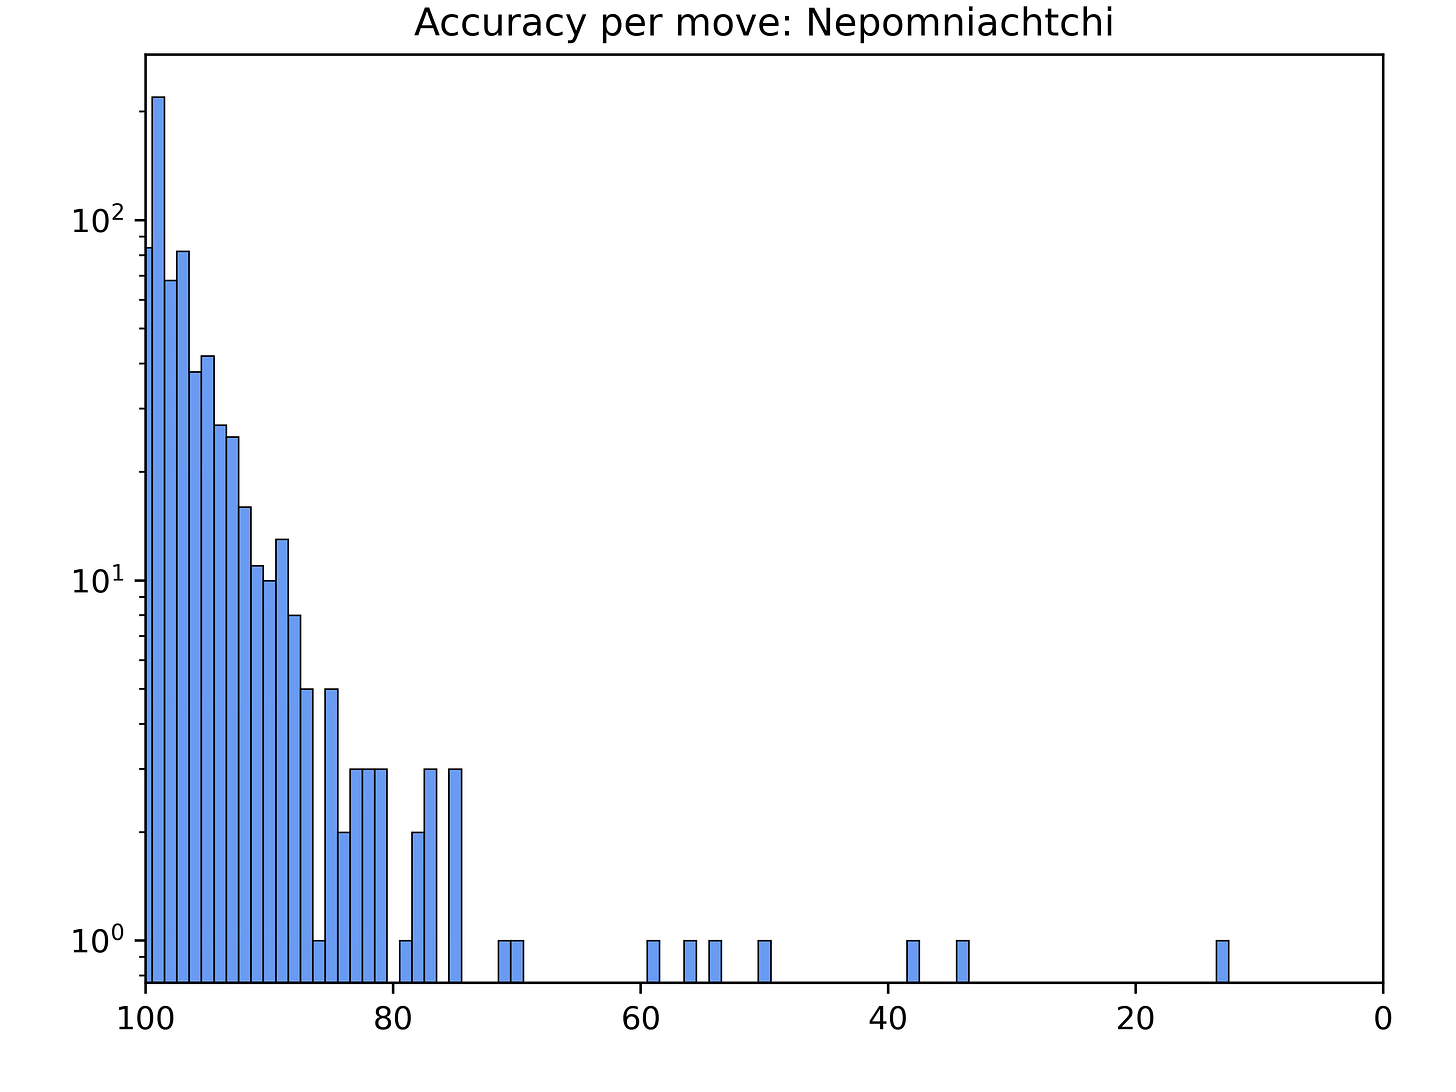
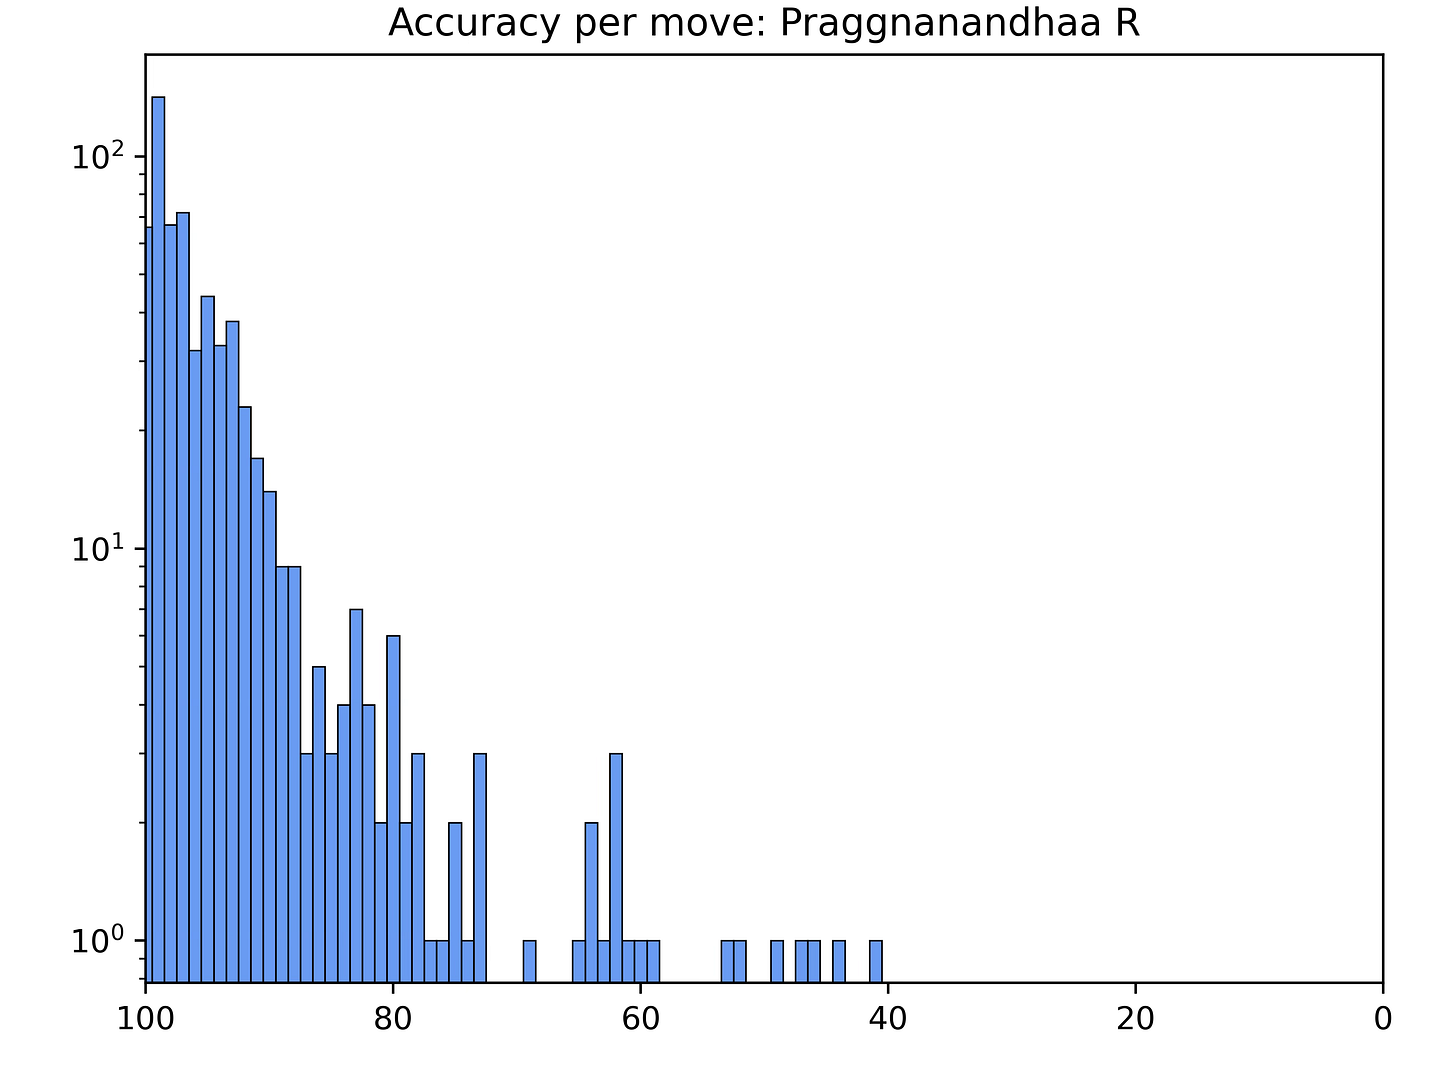
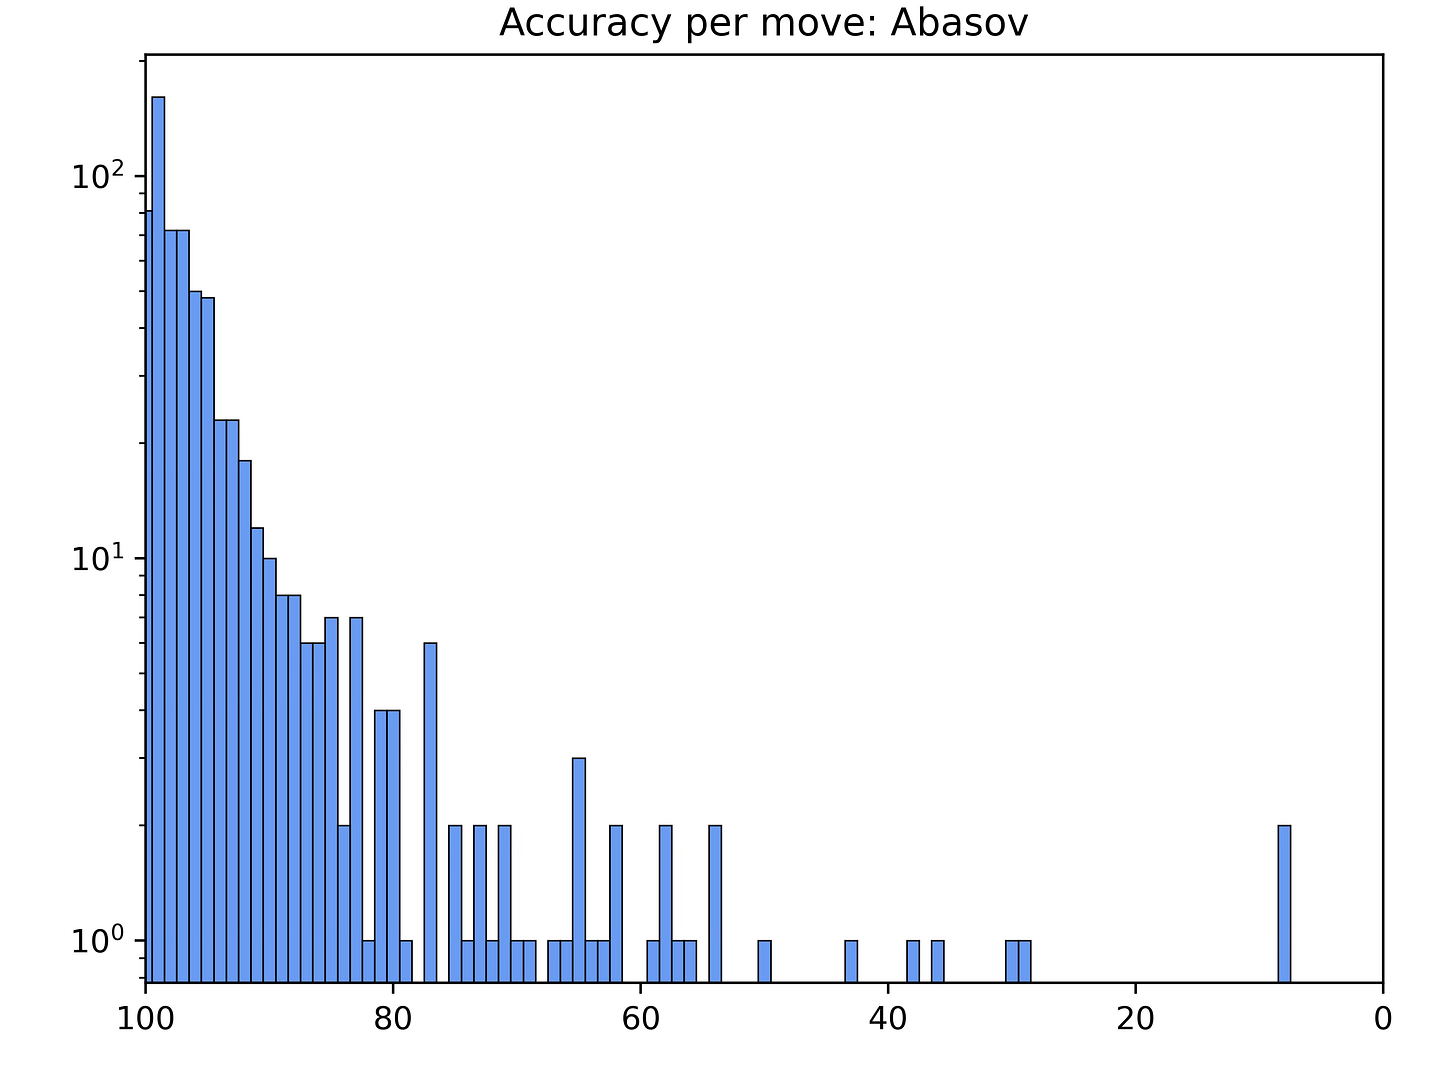
Finally, I’ve generated a plot for the accuracy distribution of each player. Previously, I’ve written about the centipawn loss distribution. These plots are similar, but they show the accuracy for each move, not the centipawn loss. I’ve also changed the y-axis to be logarithmic.
Again, these plots show just how well Gukesh played.
Future Stats & Graphs
I’ll do more such graphs for future tournaments (and maybe also for players over a year or their whole career), so I’d be very happy to hear which other stats and graphs you’d like to see included.
I haven’t done any stats regarding openings, because I didn’t have time for that. But I’ll include them in the future. I want to look at the number of novelties of each player and also some basic stats, like the most common openings and their win-rates. This will be even more relevant when looking at many games by one player, not just one tournament.
I also thought about including move times and maybe a look at the correlation between the accuracy and time taken per move. But again, this is something for the future.
If you have other ideas for new stats and graphs or suggestions how I can improve the current graphs (either the stats themselves or the look of the graphs) please let me know.






Nice. The accuracy histograms would profit from adding the average values (e.g. as a thin red vertical line) which one could then compare between players.
How about adding the centipawn statistics from that event to your previous post on centipawn loss distributions?
Can u tell us what software you are using?