
How the Evaluation and Clock impact Results of Blitz Games
Looking at Lichess games to find the effect of the remaining time and evaluation

One area that always interests me is how engine evaluations affect the result of a game, especially when the clock is a factor.
In the past, I’ve already looked at how an opening advantage impacts results in online blitz games and I’ve also looked at how the clock impacts the results in OTB blitz games.
Now I want to look at how the clock and evaluation combine to impact the outcome of online blitz games.
Evaluation and game outcomes
Before talking about how the time impacts the outcomes of games, I’d like to look at how the evaluation impacts the outcome at different rating levels.
I got the game data for this post from the Lichess database. I went through the games of 3 months and took positions from each game at some fixed move numbers. This gave me the evaluation, clock times of both players, and the eventual result of these positions. I only looked at 3+0 games for this post, as an increment would reduce the impact of the clock and higher rated players play much more 3+0 than 5+0.
First of all, I wanted to see how the expected score changes based on the level of the players. I’ve also included the Lichess formula for the expected score1 as a reference.
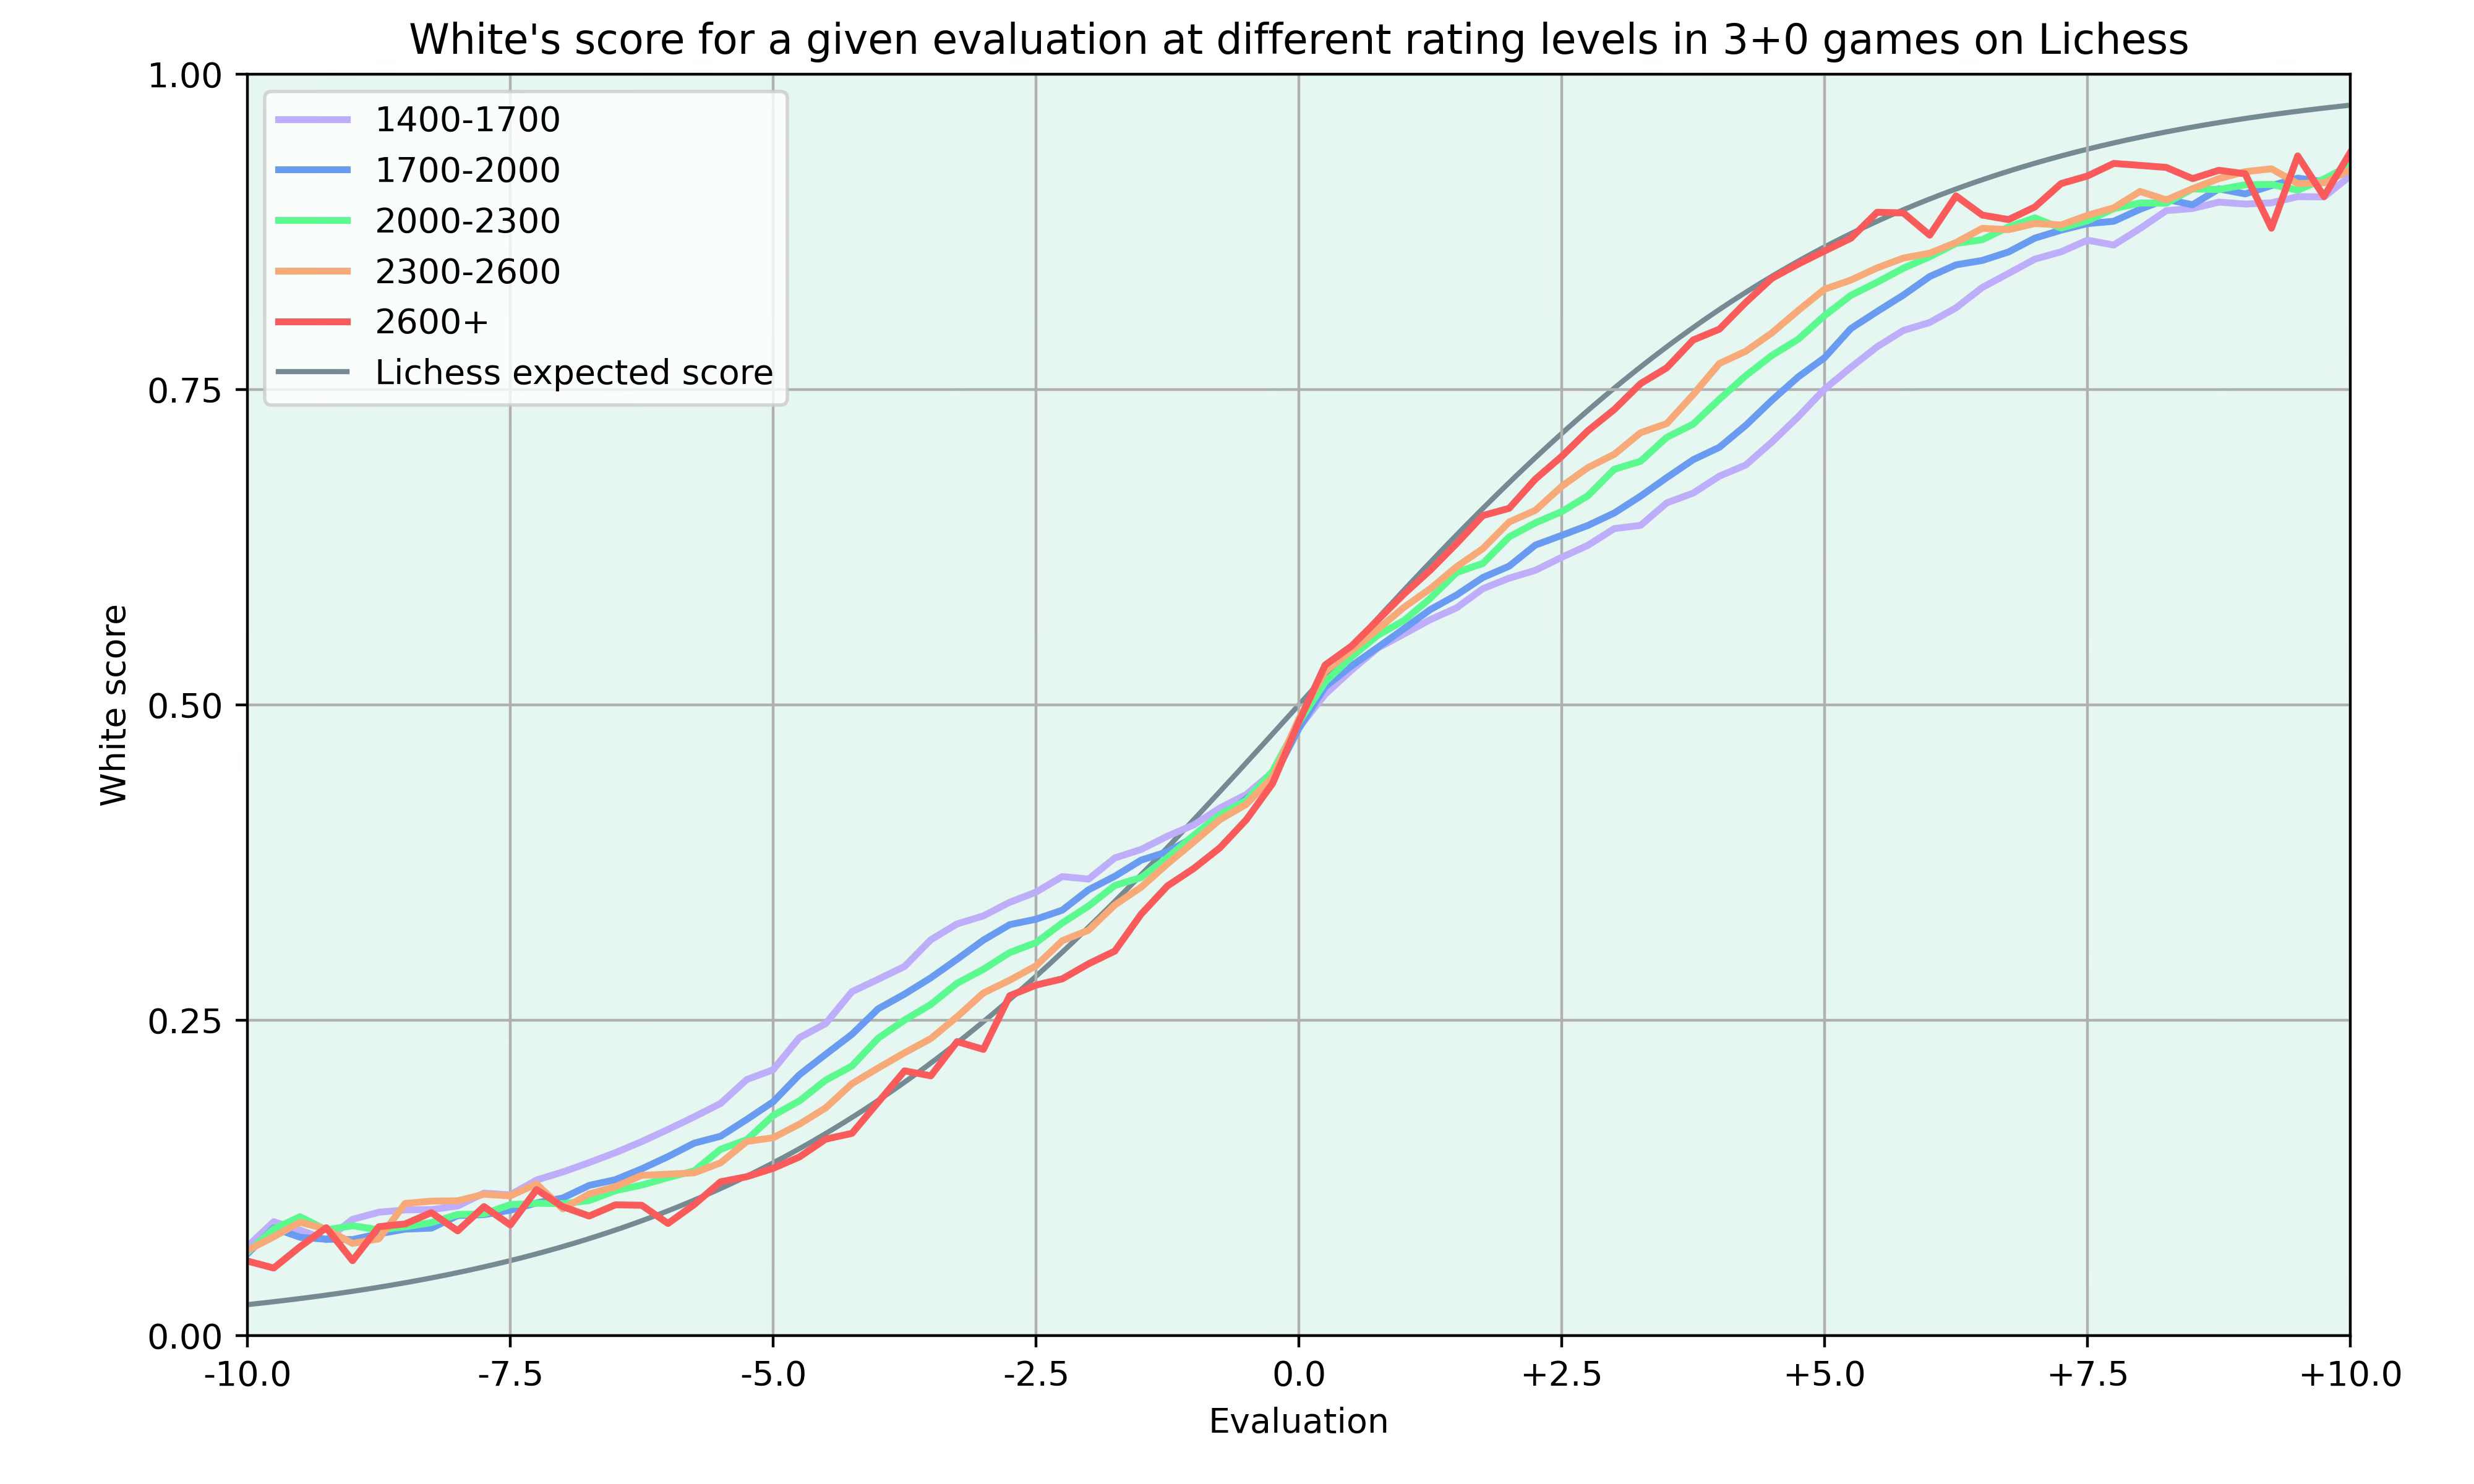
Note that I’ve capped the rating difference between two players at 100 points and all the data for a specific rating range comes from games where both players are in that rating range.
The formula used by Lichess is based on rapid games played between players rated 2300+, so it is expected that the players find it more difficult to convert advantages in blitz games.
Overall, all curves look pretty similar, but for lower ratings the curve becomes more linear. The main differences between the rating levels occurs evaluations between +1 and +6, where the lower rated players find it more difficult to convert the advantage.
The most interesting part of the plot happens at an evaluation of around -0.5. White scores much worse than expected by the formula and also compared to the score at +0.5. I guess that part of the reason is that white starts with a slight advantage, so reaching a position where white stands slightly worse may already be a sign that black is outplaying white.
Taking the clock into account
In the plot above, I’ve just shown all the data for the different rating levels, but we all know that advantages get harder to convert when there’s little time left.
To get an idea of how the time impacts the outcomes, I decided to generate heat maps showing the time left and evaluation on the axes and the outcome as colour.
Note that the heat maps show everything from the perspective of the side with the advantage, so if an evaluation is -1, I counted it as +1 and the score is given from black’s perspective.
I’m also only looking at positions where both players had similar amount of time2. When I used all games, players with less than 5 seconds on their clock won most of their games, regardless of the evaluation. I don’t know if these were games where one side left the game or if there is any other reason for this.
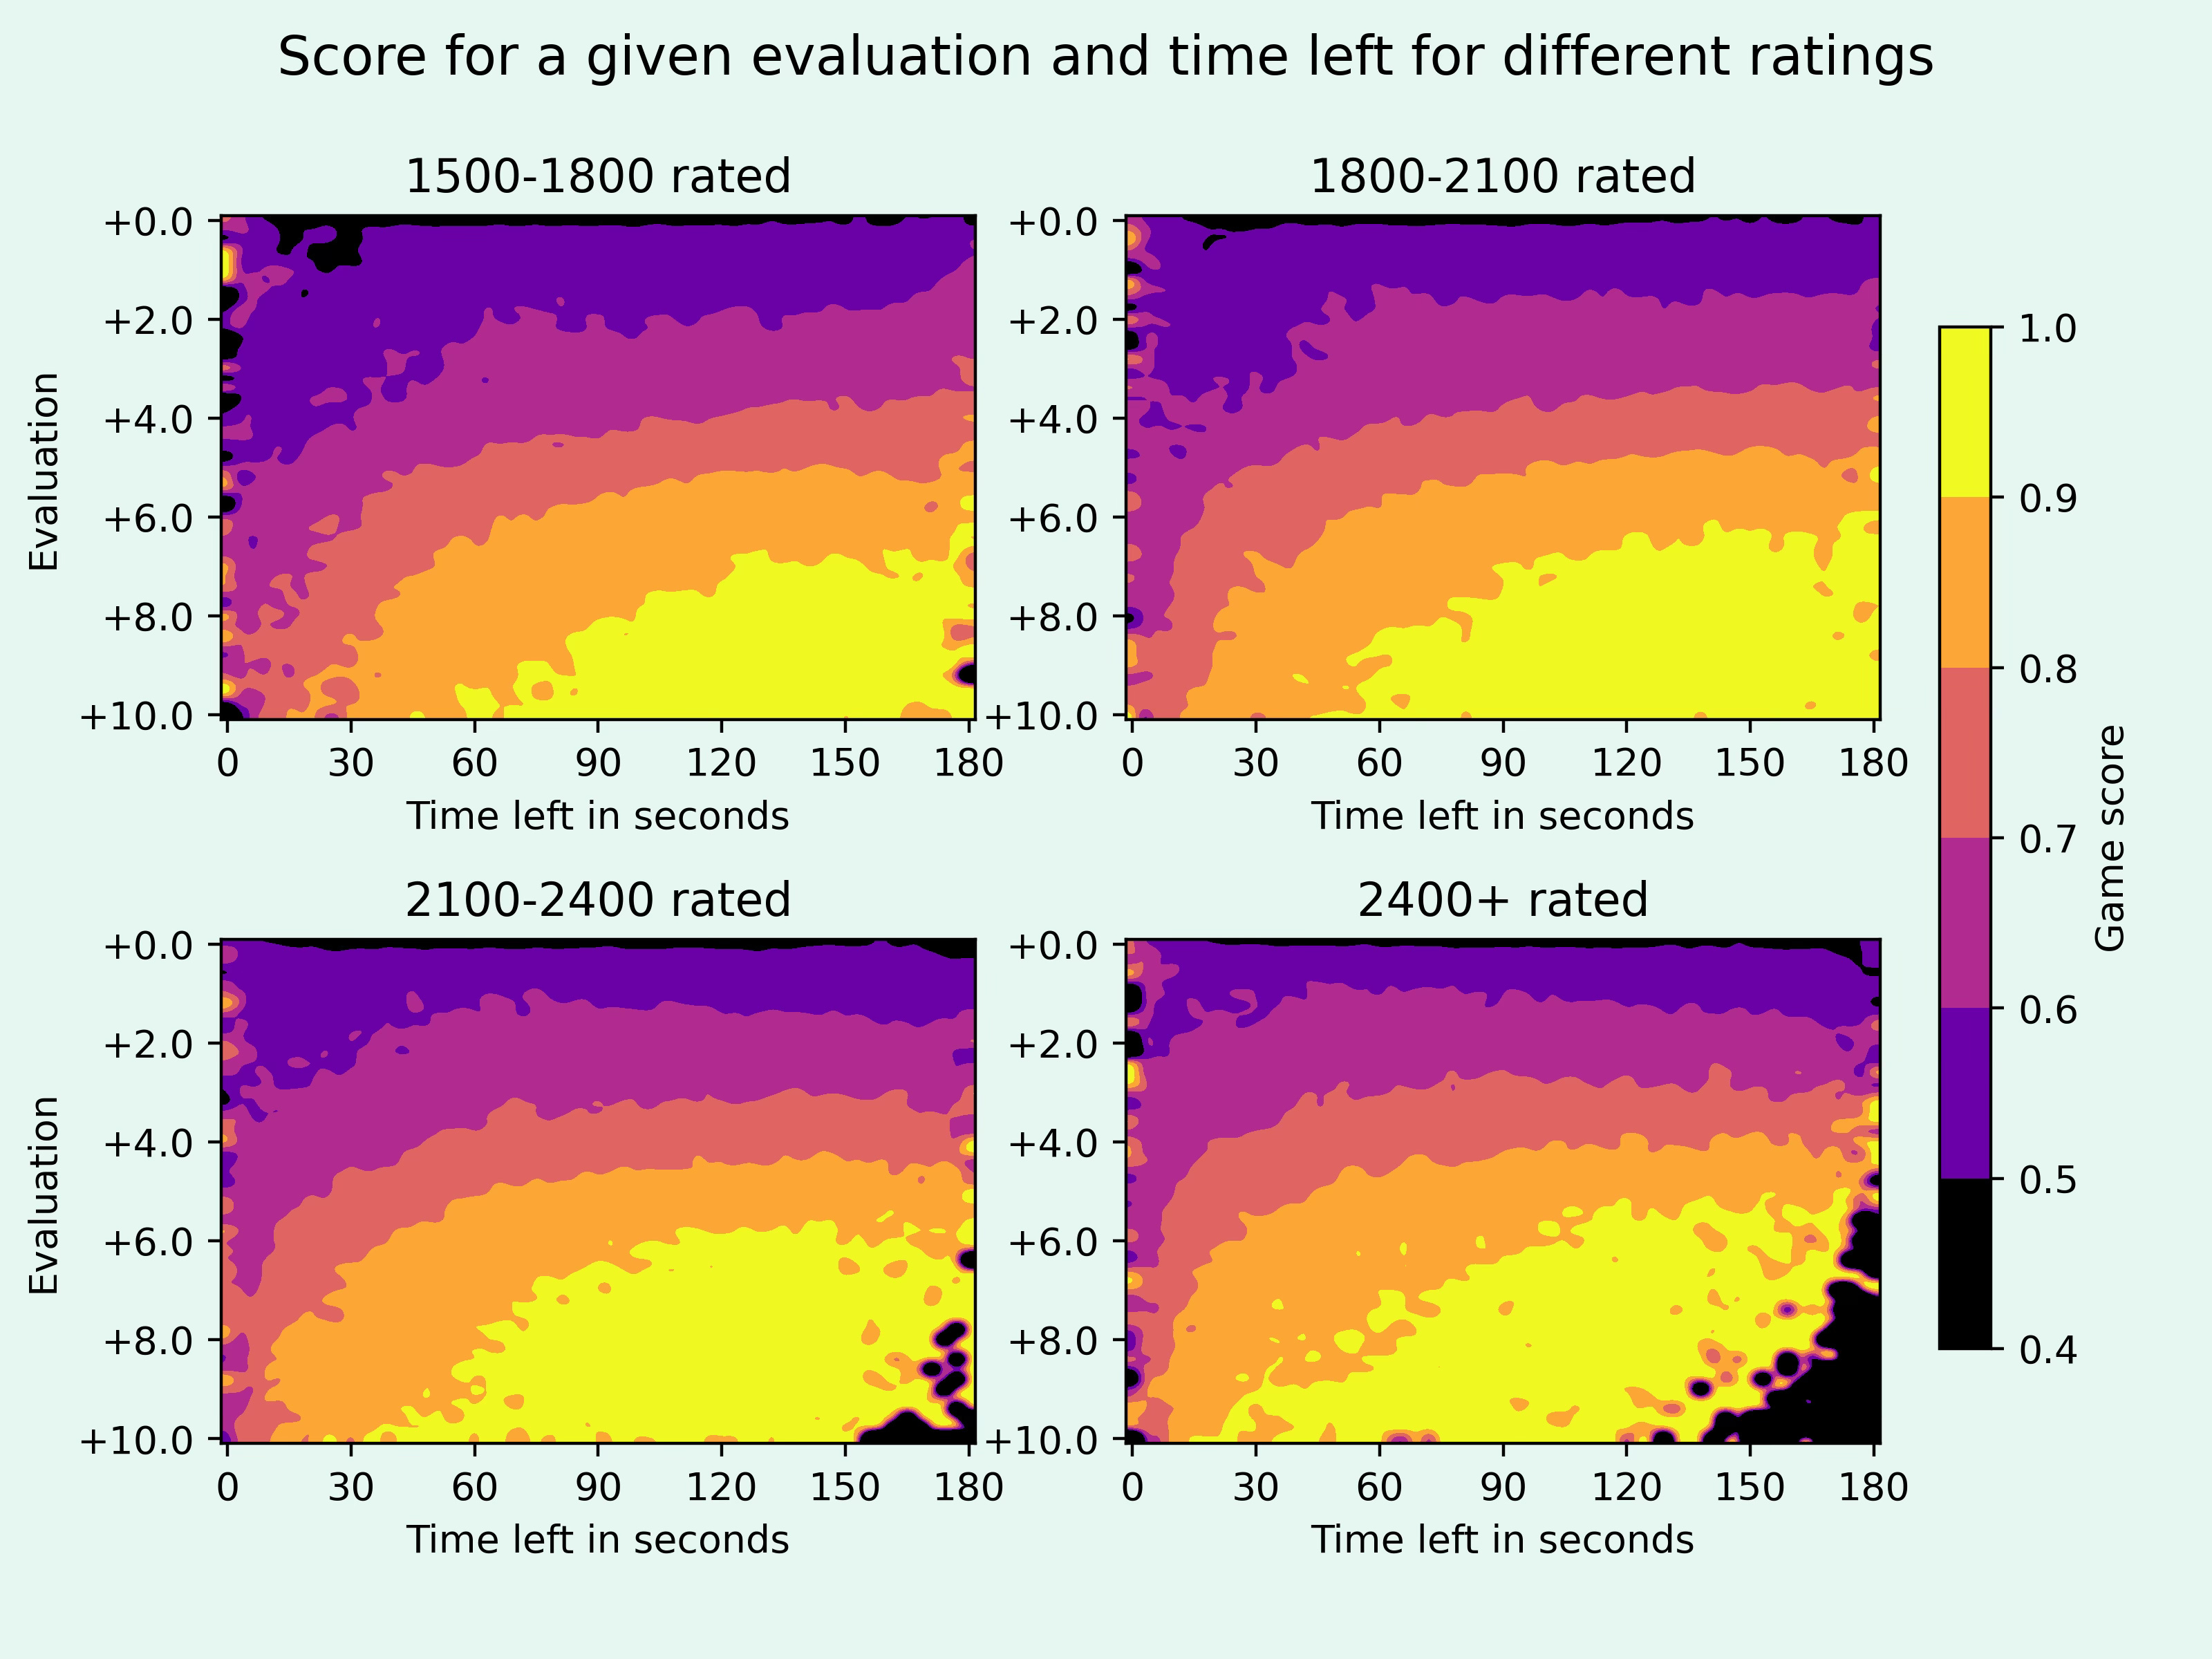
There are a couple of things to see here. First of all, note that the black areas are mostly points where there wasn’t any data. So one can see that higher rated players rarely have completely winning positions with a lot of time on their clocks, as their opponents either come better out of the opening, or resign right away when they hang a piece.
The general shape is similar for all rating levels. There isn’t much difference between having 2 or 3 minutes on the clock, as the size of the different coloured areas stays roughly the same. But as the time decreases, the yellow areas shrink quickly, as no objective advantage leads to an almost guaranteed win.
The other areas stay roughly stable before a big drop off around 10 to 30 seconds left, depending on the rating level. With little time left, all scores get closer to 50%, as the outcome just becomes more random (probably mainly dictated by who wins on time).
The heat maps are very pretty, but I find it a bit difficult to see how much the remaining time changes the outcomes. So I want to take a closer look at this for some rating levels.
I grouped the positions based on the remaining time and plotted them together with the average expected score for that level as a reference. Below you can see the graph for players rated 1600.
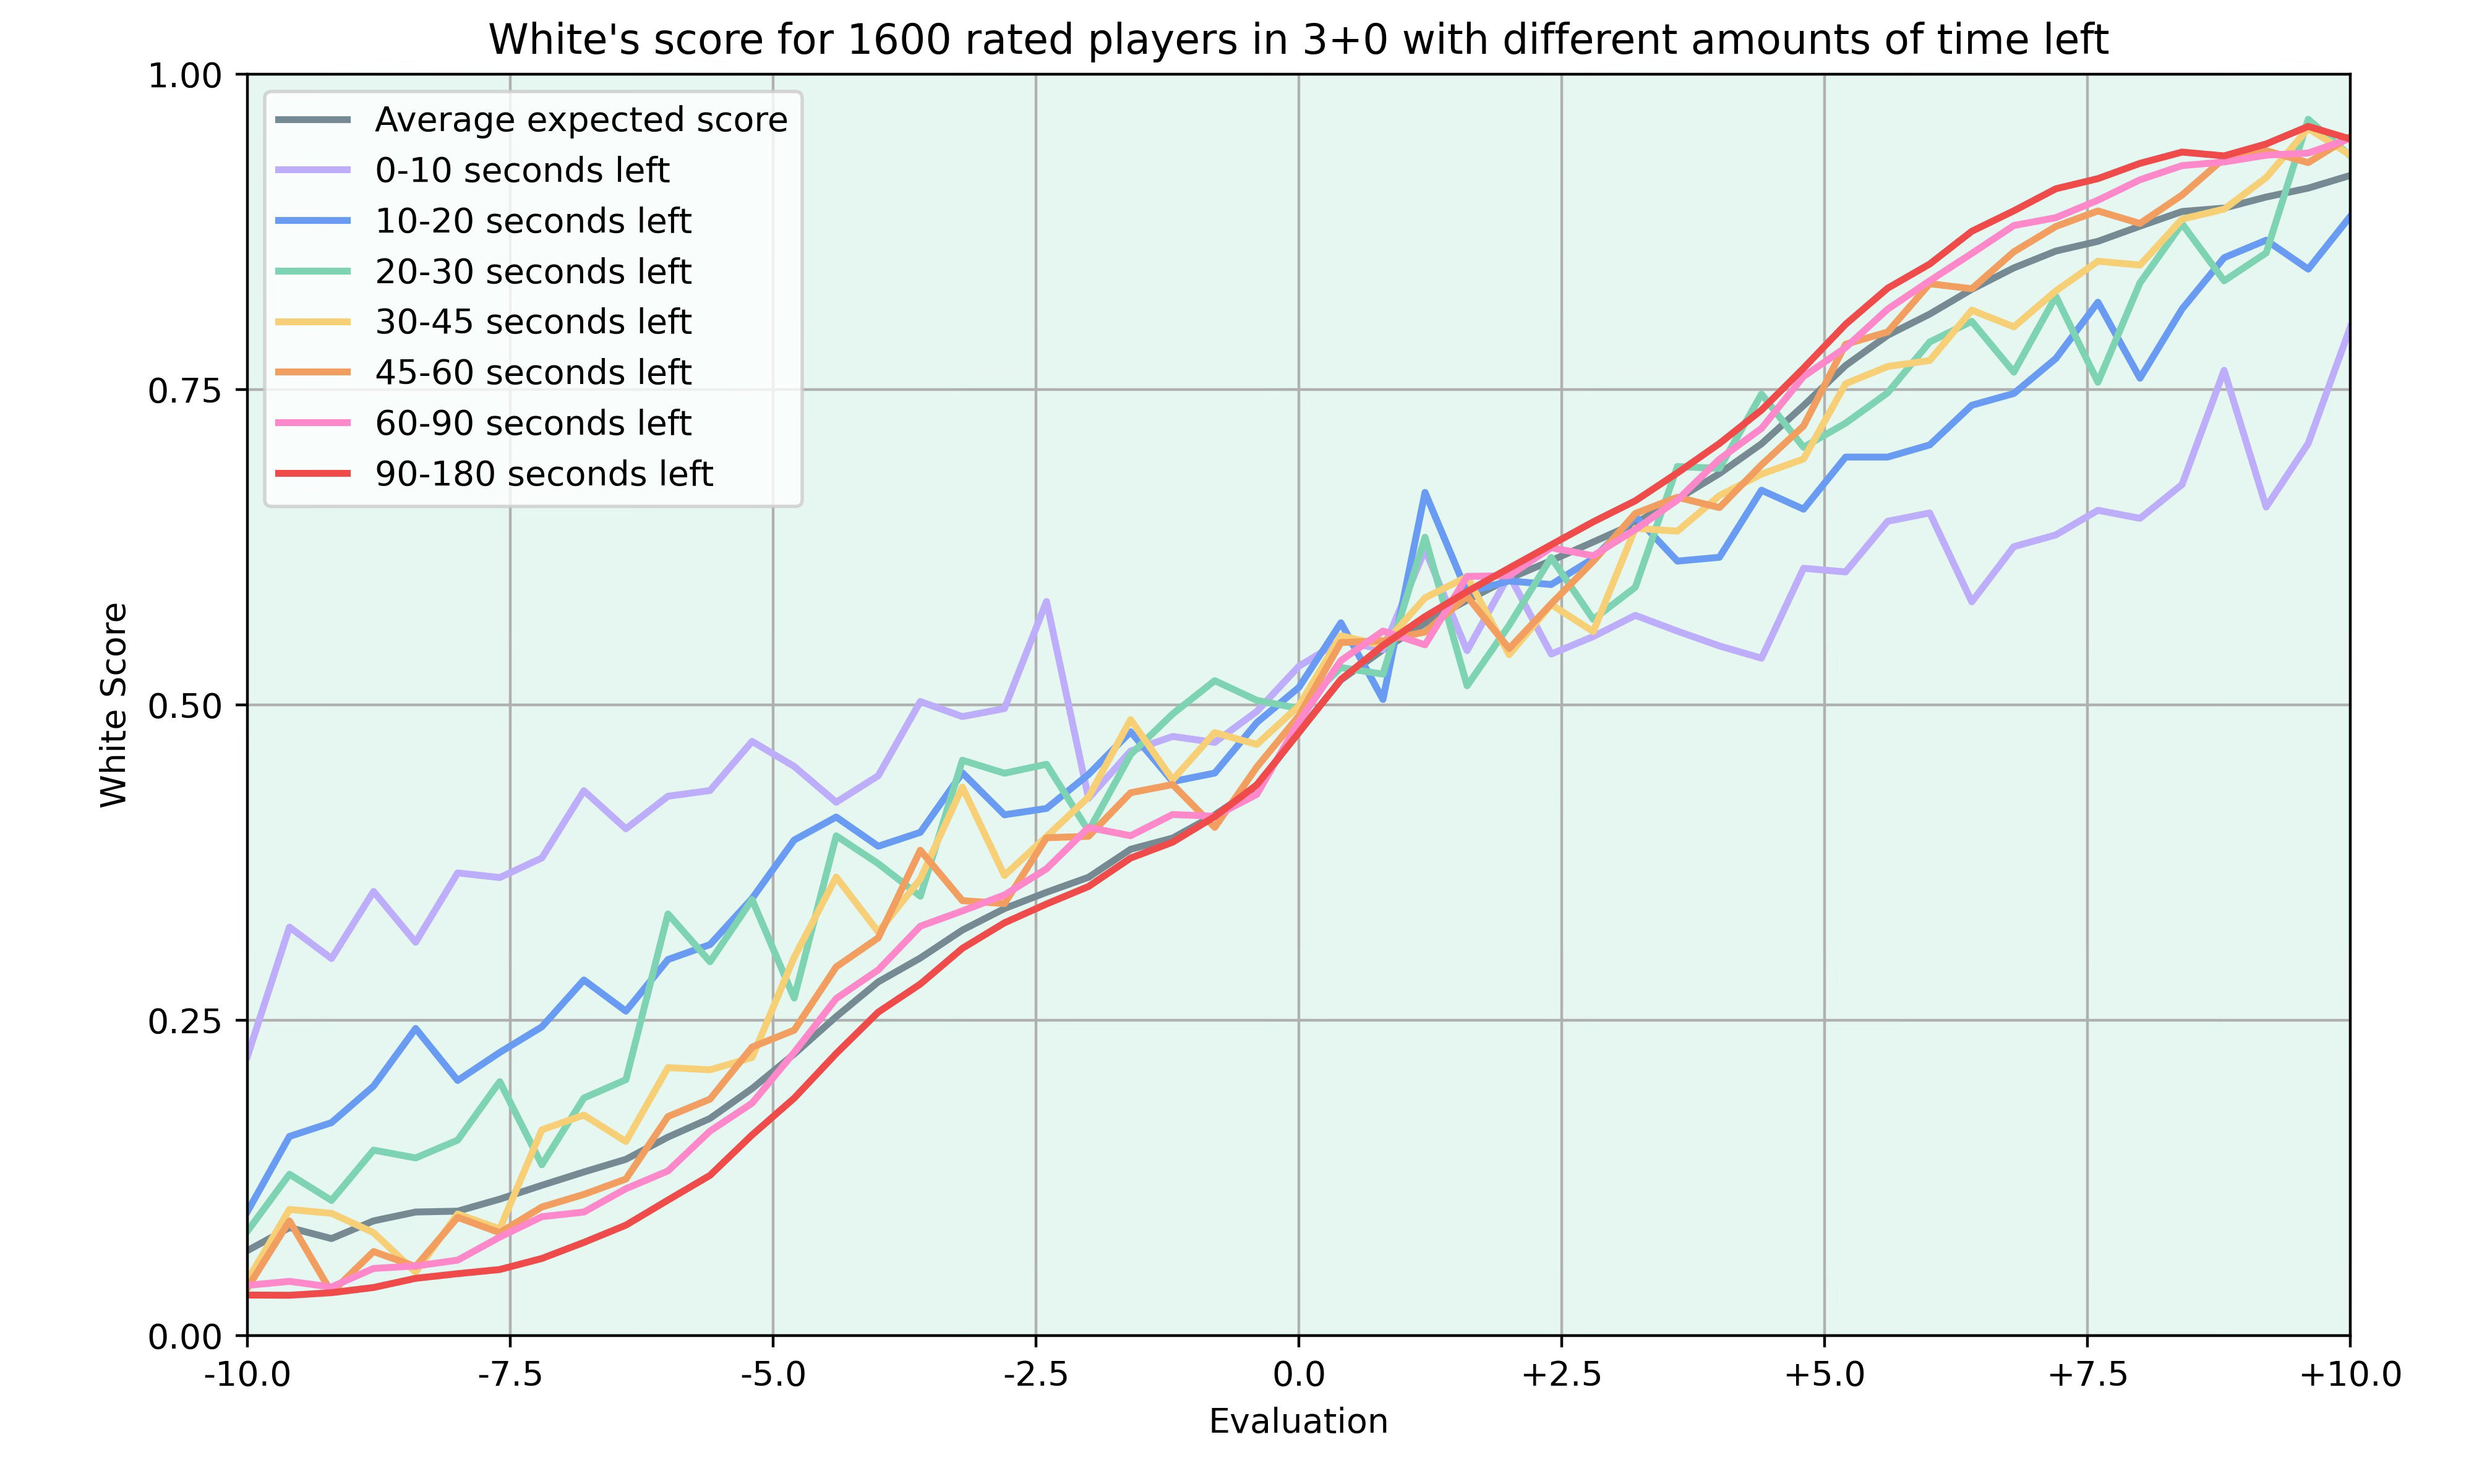
I’m a bit surprised that there aren’t more differences between the curves. The only clear outliers are the positions where a player has less than 10 seconds left.
Having less than 30 seconds still impacts the outcome, but much less than I would have expected. After that, the curves are close to the average and it’s clear that the average gets dragged down by the positions with little time left, as players with more than 60 seconds score much better than the average.
I also looked at the same data for players rated 2200.
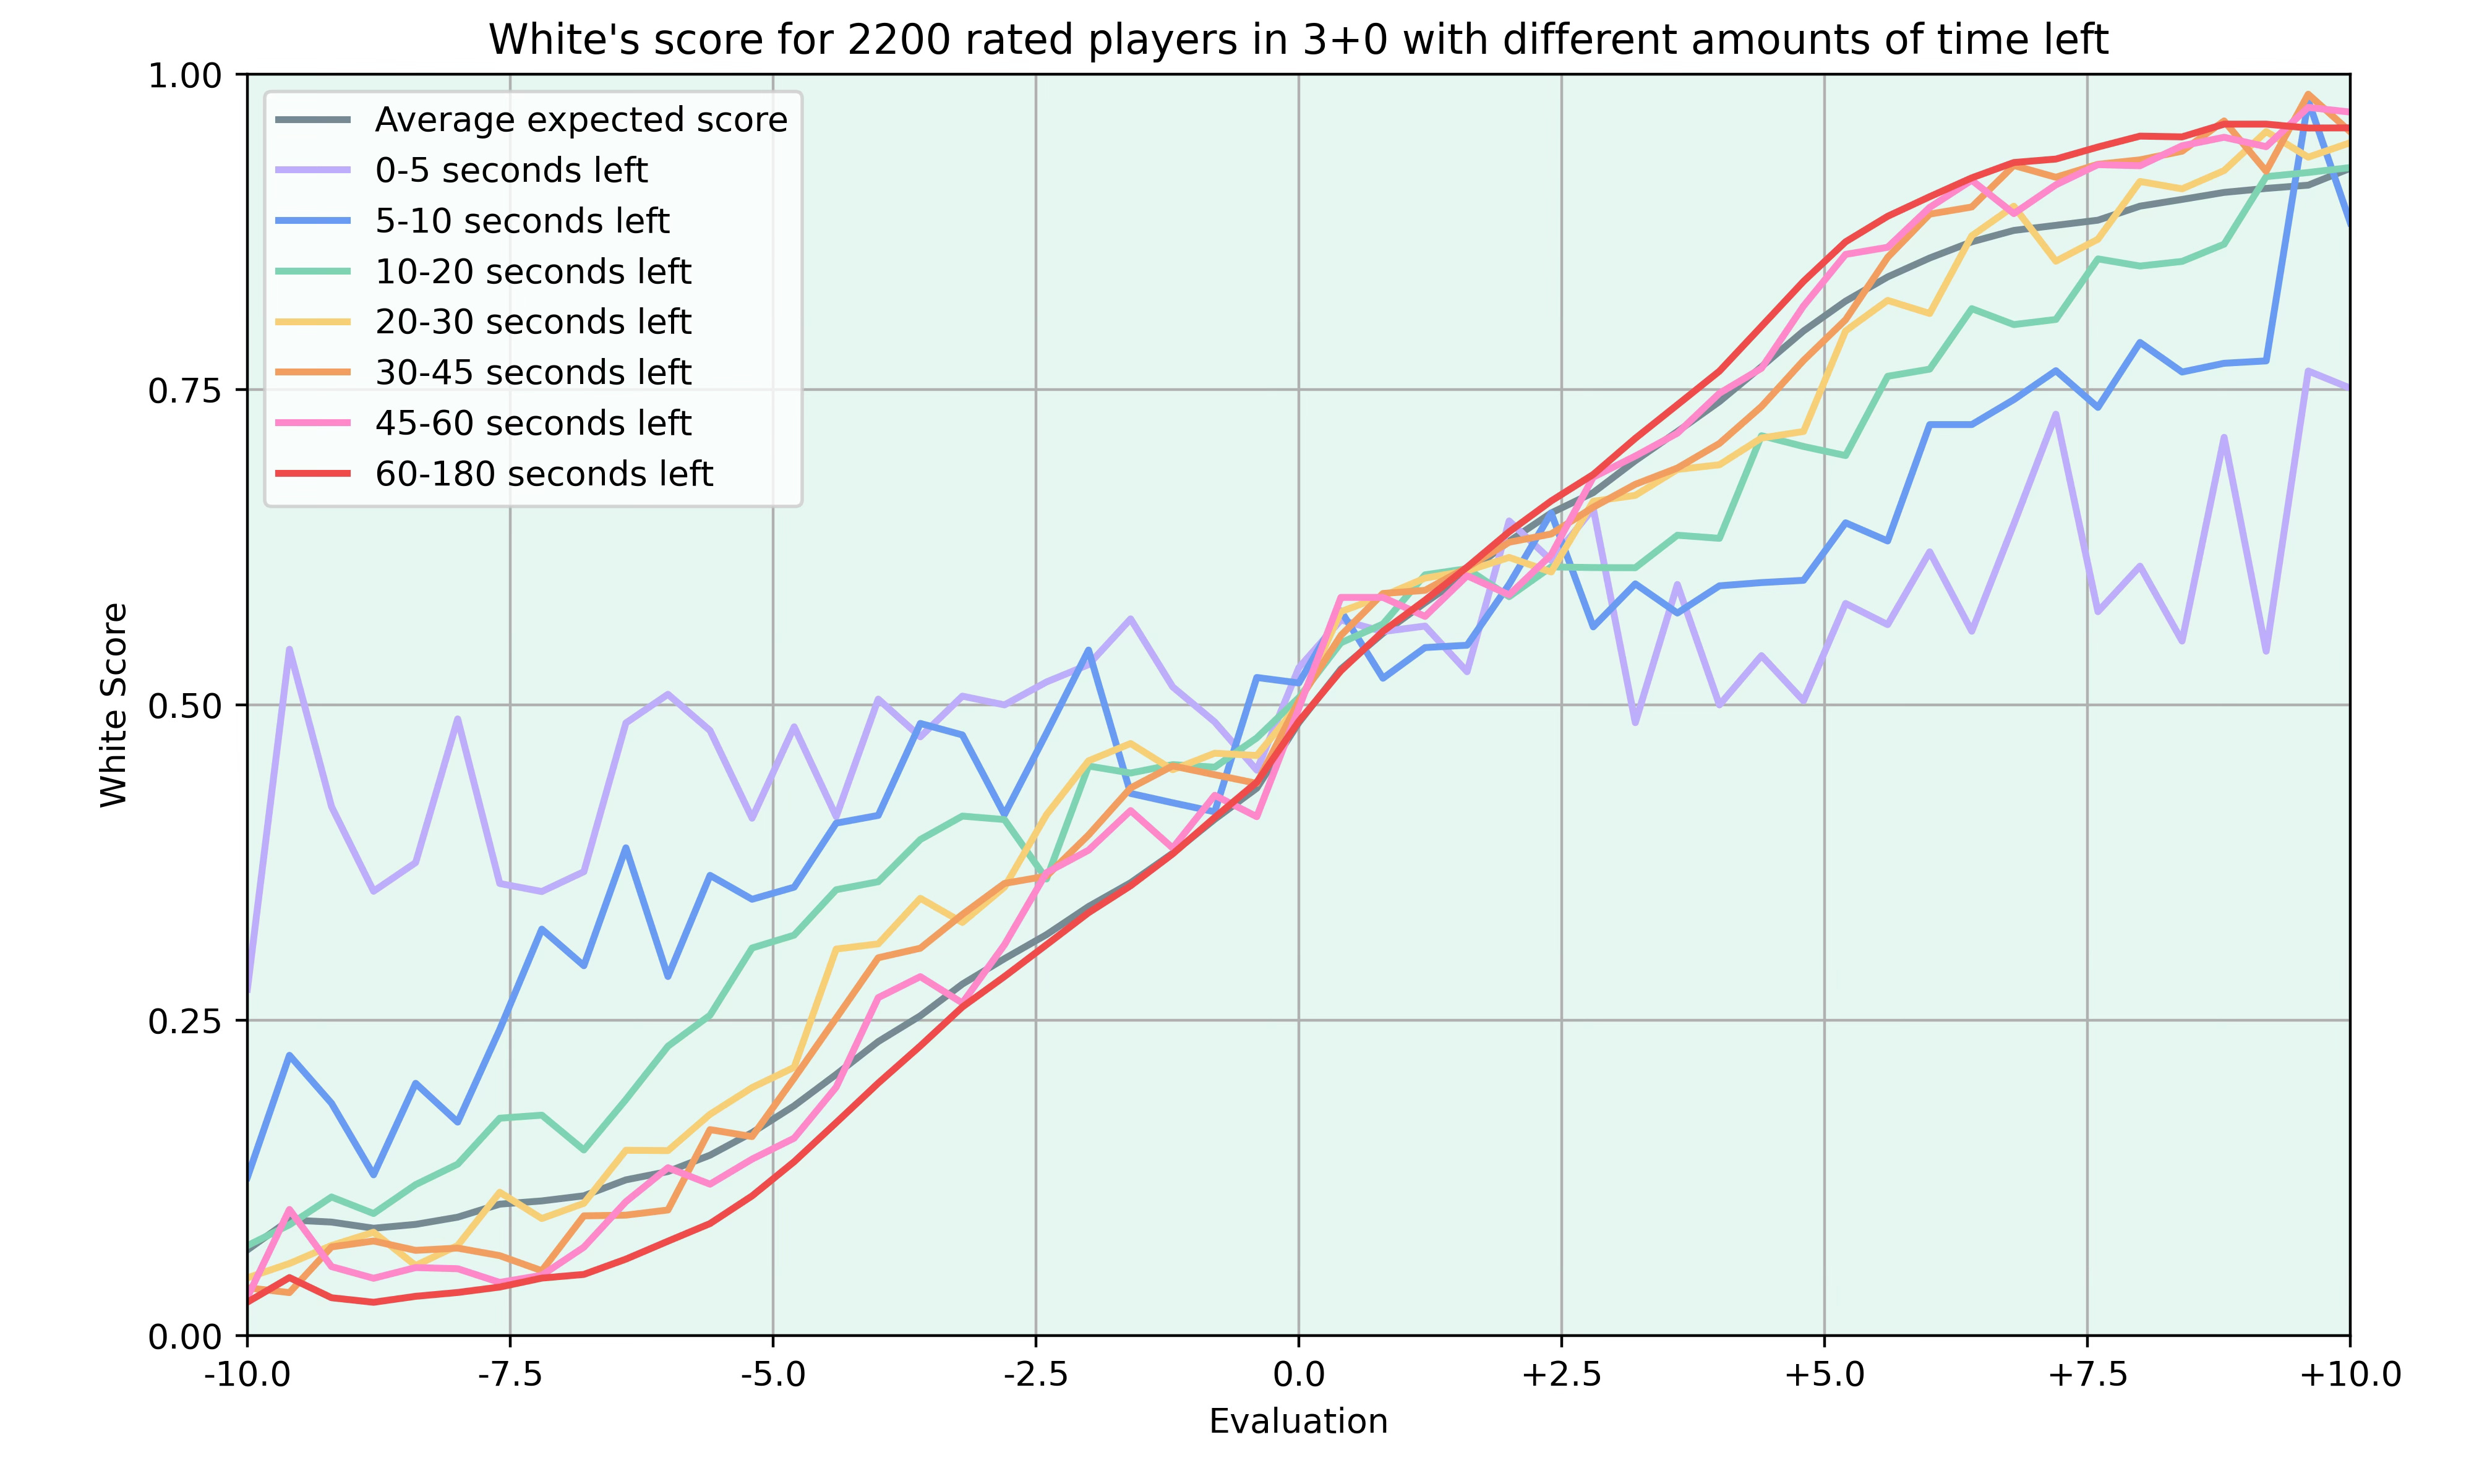
Here I also decided to plot the score when there are only less than 5 seconds remaining. The graph is very jagged, but it’s clear to see that there is hardly any difference between an objectively winning or losing position.
The only real differences are in positions where one player stands much better, but isn’t completely winning. There it seems very beneficial to have over a minute left on the clock.
Closing thoughts
I also wanted to see how a time advantage affects results, regardless of the remaining time. However, players usually scored very well when they were down on the clock. I guess that one part of the reason is that players who are in a lost position may play faster to put pressure on the clock (or because they don’t care after they’ve made a blunder). So I didn’t include it in the post, as there was clearly more at play than just the clock time.
Taking a closer look at different time controls and maybe calculating a formula for the expected score based on rating, evaluation, time left, and increment sounds like an interesting project for the future.
Let me know if there are any other stats about online games you’d be interested in.
Lichess calls it win percentage, but I’ll stick to expected score, since it’s more accurate because there are also draws
I’ve only included positions where one player had at most double the amount of time as their opponent